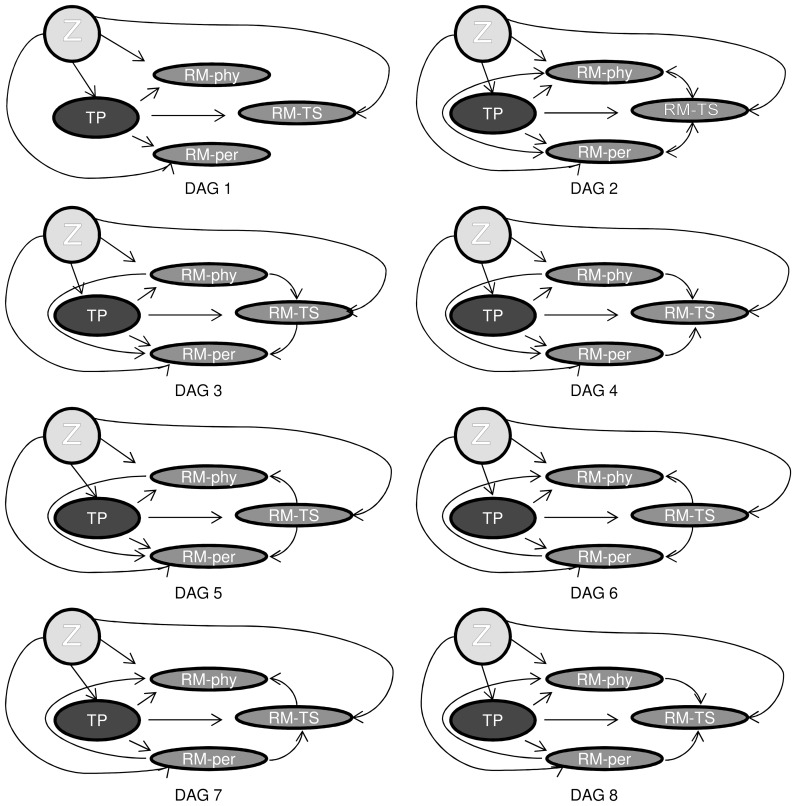
Figure 3. DAGs of the different causal relationships between teaching performance and the different role model types.
TP = teaching performance; RM-phy = role model physician; RM-TS = role model teacher-supervisor; RM-per = role model person; Z depicts the covariates namely, faculty’s sex and years of experience, residents’ sex and residency training year, hospital and specialty. (This collapsing of the covariates into one variable Z was only intended to make the DAGs more legible in this illustrative study; but we discourage doing so in actual applications.).

