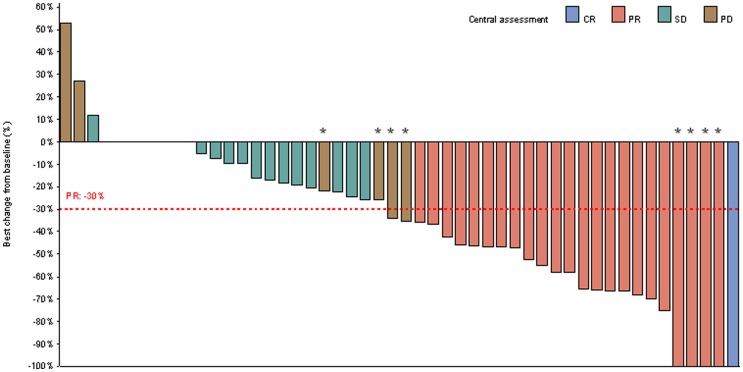
Figure 2. Waterfall plot of best change in target-lesion size from baseline, assessed by central review.
In four patients (marked with a star), the best change in total lesion size from baseline showed an overall decrease but they were characterized as having progressive disease (PD) due to the development of new lesions. In four other patients (marked with a star as well), the best change in total lesion size from baseline was 100% but they were identified as partial response (PR) since in non-target lesions the response was stable disease (SD). CR: complete response.

