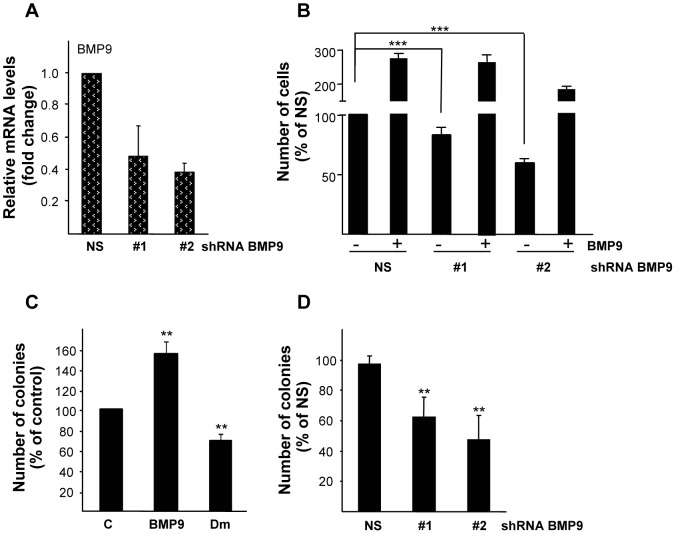
Figure 4. BMP9 production supports HepG2 anchorage dependent and independent cell growth.
A. Independent stable cell lines expressing non-silencing (N.S.) and two different shRNAs targeted against BMP9 were generated by retroviral infection of HepG2 cells. BMP9 mRNA levels were determined by quantitative RT-PCR and normalized to 18S. Data expressed relative to N.S. cells (assigned an arbitrary value of 1) from 3 different experiments (mean ± S.E.M). B. Non-silencing (NS), shBMP9#1 and #2 stable HepG2 cell lines were incubated in 0.5% FBS and −/+ BMP9 (5 ng/ml) and counted at day 6. Data from 6 independent experiments performed in triplicate, displayed as percentage of N.S. untreated cells (mean ± S.E.M). C. HepG2 cells were plated in soft agar and treated with BMP9 (5 ng/ml) or with dorsomorphin (Dm, 1 µM) for 3 weeks (added twice a week) and the colony number was counted. Data (n = 4, BMP9; n = 8, Dm) are displayed as percentage of control cells (mean ± S.E.M). D. Previously generated non-silencing (N.S.), shBMP9#1 and #2 stable HepG2 cell lines were plated in soft agar and counted after 3 weeks. Data from 4 experiments, displayed as percentage of N.S. cells (mean ± S.E.M). Statistical analysis was carried out using paired t-test and data were compared to untreated N.S. or control samples or as indicated, * = P<0.05, ** = P<0. 01, *** = P<0.001.

