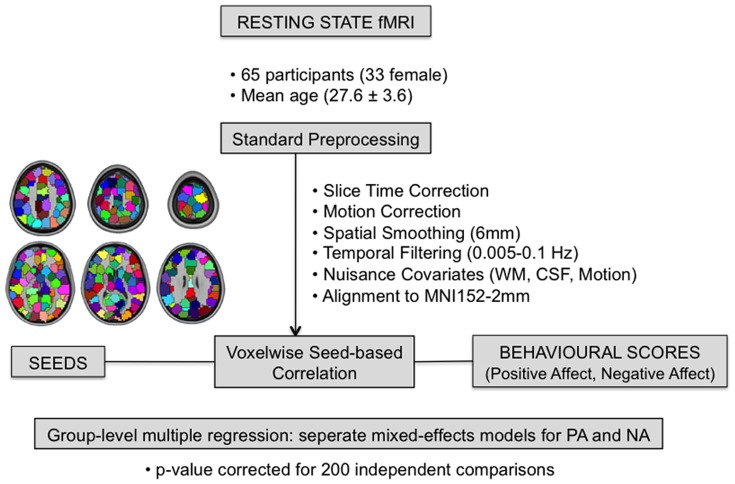
Figure 3. Data processing path.
Following standard pre-processing of the resting state fMRI data, connectivity was calculated between the time courses of each of the 200 functional seeds and all the voxels in the brain. These connectivity scores were correlated with PA and NA scores in separate analyses, which were followed by a group-level multiple regression and two conjunction analyses.

