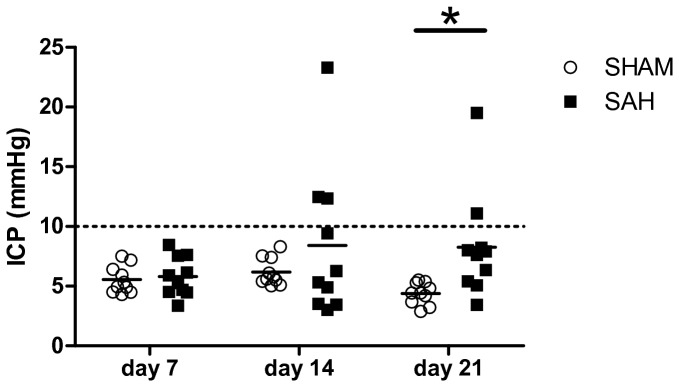
Figure 2. Time course of intracranial pressure.

Intracranial pressure (ICP) in mmHg at three different time points in SHAM or SAH animals. Repeated-measures two-way ANOVA showed a significantly different time course of ICP in SHAM or SAH animals (p<0.05). * p<0.05 for the post-hoc comparison of SHAM vs. SAH at day 21 (Bonferroni-corrected).
