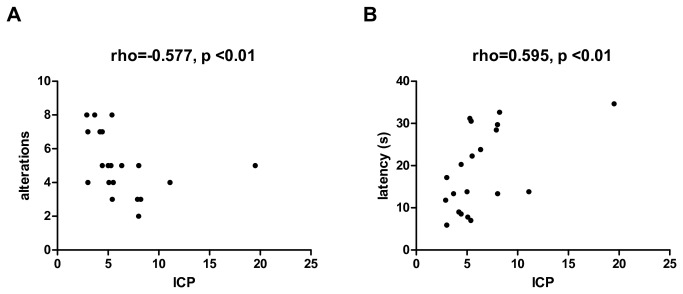
Figure 3. Correlation between behavior and intracranial pressure.
Correlation analyses between the results of T-maze test at day 21 after surgery and intracranial pressure (ICP) in SHAM and SAH animals. Number of alterations (A) and mean latency to decision in seconds (B). Spearman’s rho and p-values are given.

