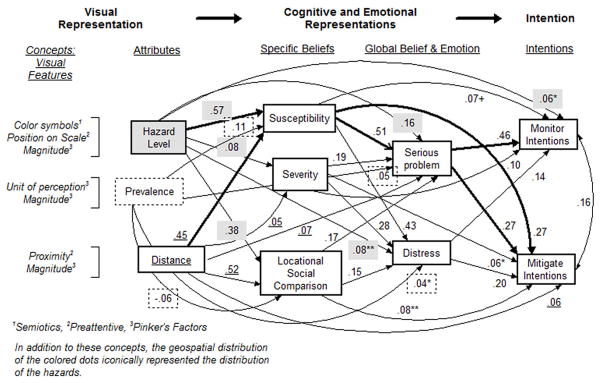
Figure 4.

Path model with distance map attributes and standardized path coefficients. Labels at the top (bolded in row one and underlined in row two) illustrate how the path modelis aligned with The Framework. Visual cognition concepts on the left illustrate theoretical concepts embodied in each attribute. Symbols facilitate matching path coefficients from attributes to variables (hazard level = shading; prevalence = dotted outline; distance = underline). Primary mediating paths from attributes through beliefs to intentions are bolded. All path coefficients significant at p < .001 unless otherwise noted: +p < .10, *p < .05, **p < .01. Non-significant (ns) coefficients are not depicted in the path model. ATable showing all standardized path coefficients is available at http://research.son.wisc.edu/wellstudy/PathCoefficients.pdf.
Path Model Fit Indices are: SRMR = .061 and CFI= .896. Standardized loadings for covariates are: sex on severity = .37, numeracy on susceptibility = .02ns, current water use on mitigate= +.04, prior residence on mitigate = +.05 current water use on monitor = 0, prior residence on monitor= −.04ns.
