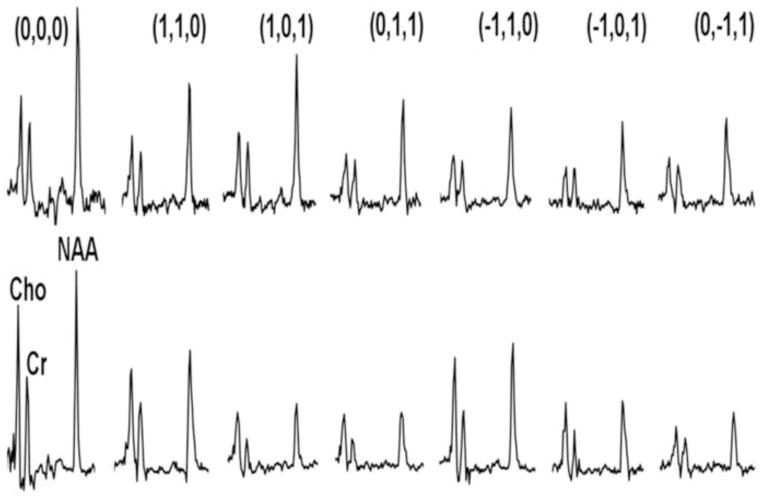
Figure 3.
Sample water-suppressed MRS spectra showing the modulation of metabolite signal with diffusion gradients. The top row shows data from a typical healthy control, the bottom row from a schizophrenia patient. In each row, the leftmost spectrum is with no gradients applied, and the next 6 spectra show a variety of x/y/z gradients as shown. Note the variable decrement in metabolite signal with differing gradients, giving rise to the calculation of the diffusion tensor.

