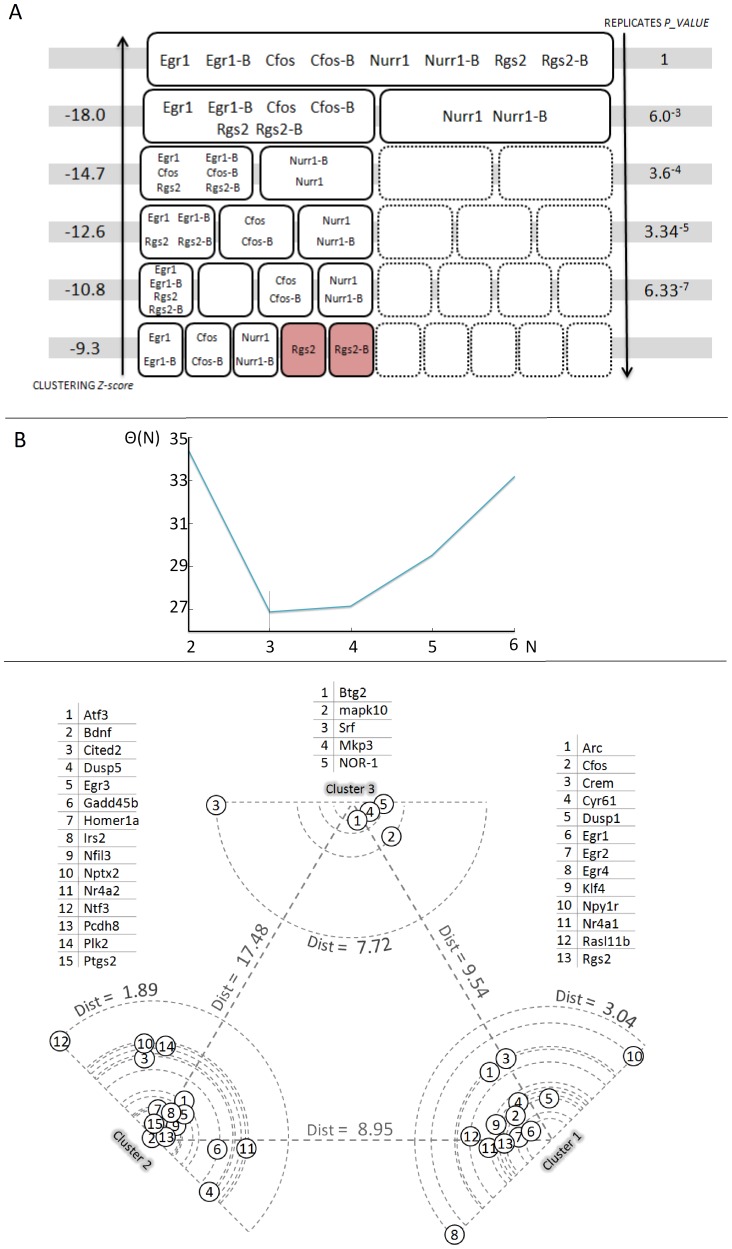
Figure 3. Analysis of the clustering quality for the time course data.
A) Outcome of the clustering algorithm, with progressive increase in the number of clusters k: the picture represents, at each different k, the grouping of the 4 couples of alternative primers pointing to the same gene. For k = 2,4,6,8 the alternative primers were correctly grouped together. The “replicas p-value”, on the right, indicates the statistical consistency of the alternative primer grouping, which reaches it maximum value when the algorithm is forced to split the 33 genes into 8 different clusters. On the left, the Z-value of the global clustering, indicating the consistency of the temporal dynamics discrimination. B) Outcome of the algorithm aimed at determining the optimal value for k. The number of clusters N is plotted against a function Θ(N): the minimum of Θ(N), i.e. N = 3, coincides with the optimal value for k. See Materials and Methods section for further details. C) Visual representation, with k = 3, of the distances between trajectories and cluster centroids for all the 33 genes. For each cluster, the genes are disposed at increasing distances from the centroid, proportionally to their normalized Euclidean distances. The distance of the farthest gene is indicated in the proximity of the outer circle. The orientation of the genes reflects the proximity to the remaining two clusters. The distances between the cluster centroids are also indicated.

