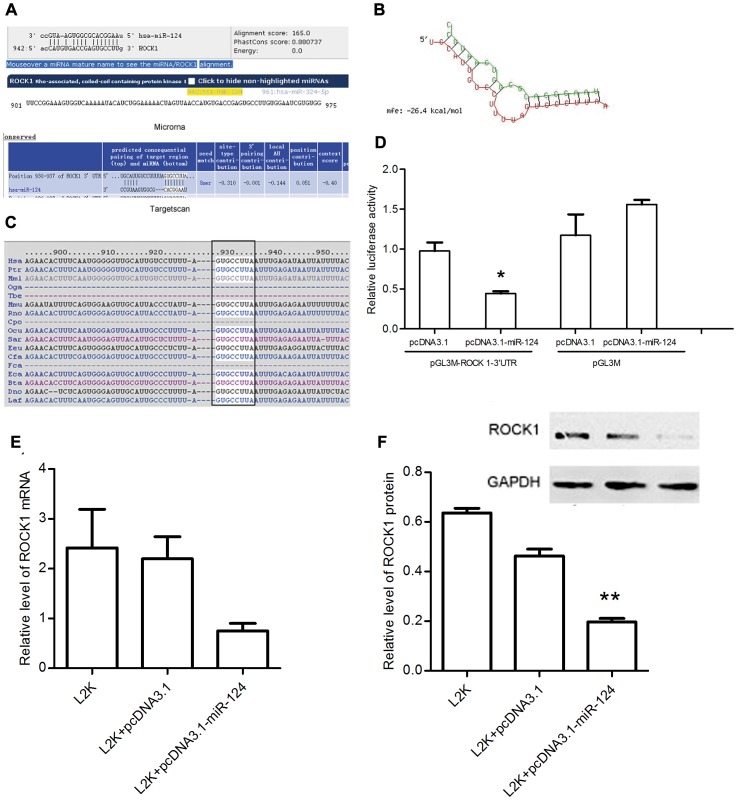
Figure 3. ROCK1 is target of miR-124.
(A) Illustration of the predicted miR-124-binding sequences in the 3′UTR region of ROCK1. (B) The calculated free energy for hybridization of the ROCK1 3′UTR and miR-124 (Red color: ROCK1, Green color: miR-124). (C) Homology analysis of the 3′UTR sequences of 13 different species recognized by miR-124 seed sequence. (D) Luciferase analysis in HEK293ET cells. The assay was repeated three times with each assay being performed in three wells, and similar results were obtained each time. (E) qRT-PCR assay of ROCK1 levels treated with either pcDNA3.1 or pcDNA3.1-miR-124 for 48 h, compared with mock control in U87MG cells. (F) Western blot analysis of ROCK1 expression treated with either pcDNA3.1 or pcDNA3.1-miR-124 for 72 h, compared with mock control in U87MG cells.

