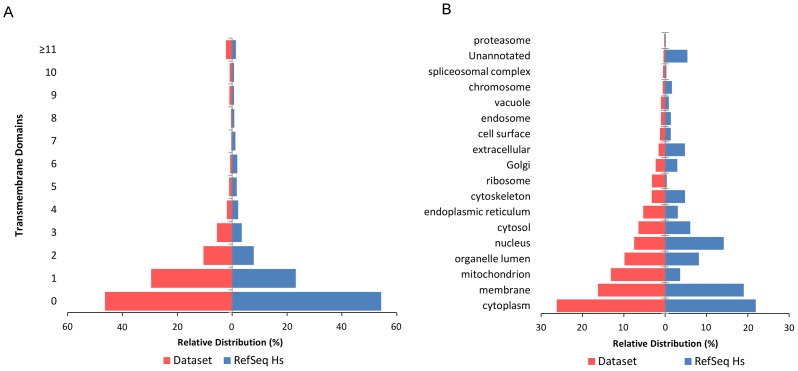
Figure 3. Distributions of transmembrane domains and cellular compartments of proteins in the dataset.
Figure 3A shows the tornado diagram of transmembrane domains in proteins from both the complexome profiling dataset and the complete RefSeq Homo sapiens database. A relative enrichment of 8% more proteins with transmembrane domains was observed for the complexome dataset with respect to the RefSeq Hs database. The tornado diagram for the cellular compartment distribution of proteins in figure 3B show an enrichment of mitochondrial proteins in our dataset compared to the RefSeq Hs database. Please note that proteins may have multiple cellular compartment GO annotations.

