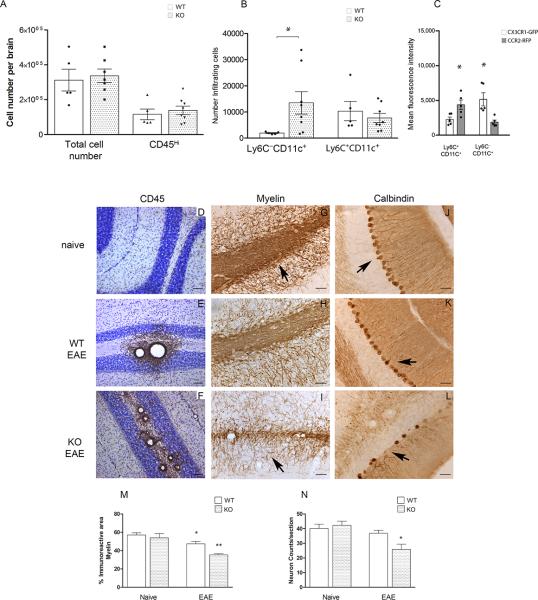
Figure 2. CX3CR1-deficient mice showed an increased accumulation of CD11c+ dendritic cells in CNS correlating with more severe CNS pathology.
Brain mononuclear cells isolated at peak of EAE disease from Cx3cr1GFP/+/Ccr2RFP/+ and Cx3cr1GFP/GFP/Ccr2RFP/+ were separated over Percoll gradients and analyzed by flow cytometry. A) Total number of brain mononuclear cells and CD45Hi infiltrating cells. (B) CD45Hi infiltrating cells were gated to quantify myeloid cell subsets based on expression of CD115, Ly6C and CD11c. Open bars: Cx3cr1GFP/+/Ccr2RFP/+ mice with normal receptor function; shaded bars: CX3CR1-deficient Cx3cr1GFP/GFP/Ccr2RFP/+ mice (* P <0.05). (C) CX3CR1-GFP (open bars) and CCR2-RFP (gray bars) fluorescence intensities in monocyte subsets were compared in Cx3cr1GFP/+/Ccr2RFP/+ mice (* P<0.05). Values are mean ± SEM. Results are representative of two similar experiments. Brain tissues were stained with anti-CD45 antibodies (brown staining) as a marker of global inflammation and counterstained with Nissl (D-F), anti-MBP antibodies to assess demyelination (G-I) and anti-calbindin antibodies to visualize cerebellar Purkinje cells (J-L) in Cx3cr1–/– naïve (D, G, J), diseased WT (E, H and K) and Cx3cr1–/– (F, I, and L) mice. Scale bars D-F: 100 μm, G-L: 50 μm. (M) Myelin immunoreactive area, *P=0.03 between WT naïve and WT-EAE groups, **P<0.0001 between WT-EAE and KO-EAE groups. (N) Calbidin positive cells per section were counted in 4 mice per group *P=0.04 between WT-EAE and KO-EAE groups.

