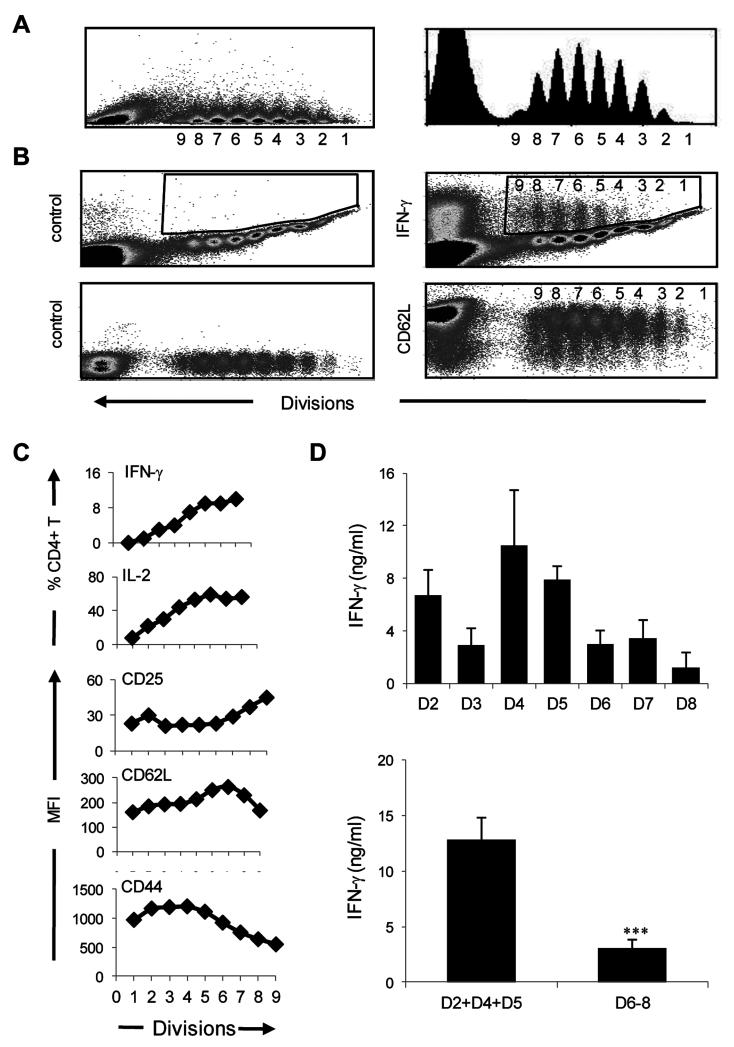
Figure 1. The effector phase includes moderately activated early and highly activated late cells that develop different recall IFNγ responses.
CFSE-labeled naïve DO11.10 T cells were transferred into BALB/c mice and the hosts were immunized with OVAp in CFA. Three days later the LN cells were harvested and the number of cell divisions, the frequency of cytokine responders and expression of activation markers were analyzed. (A) shows the effector divisions as measured by CFSE dilution and presented in dot plot and histogram format. (B) shows intracellular and surface staining of cell divisions with isotype controls (left panel) and anti-IFNγ and anti-CD62L antibodies, respectively (right panel). (C) shows percent of CD4 T cells producing cytokines and MFI for the indicated markers compared to isotype control. (D) The LN cells in each effector division were sorted, transferred into naïve BALB/c mice (5 × 10⁴ cells/mouse) and the hosts were immunized with a suboptimal dose of OVAp in CFA. The mice were sacrificed at day 4 and 6 and the LN cells were stimulated with 10 μM OVAp and IFNγ responses were measured by ELISA. Immunized mice with no transfer of effector T cells were used as baseline control for IFNγ responses. The top plot shows the mean of IFNγ response of each division at day 4 and 6. Each point represents the mean ± SE. The bottom plot shows a summary of data comparing the mean ± SE memory IFNγ response of early (D2, D4 and D5) and late (D6, D7 and D8) divisions at the peak of their responses. ***p<0.005. The results are representative of 4 independent experiments.

