
Figure 5.
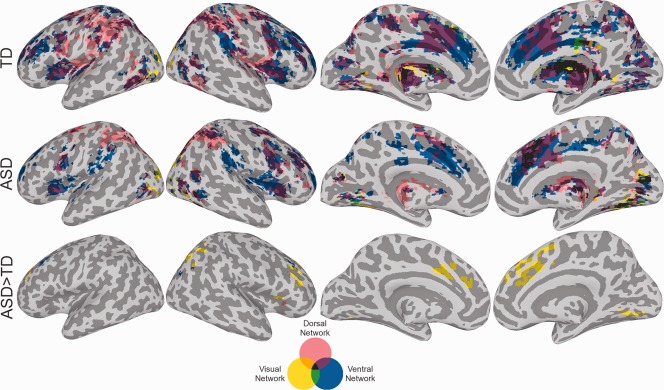
Conjunction maps for the whole brain functional connectivity analysis for dorsal, ventral, and visual networks. Connectivity maps adjusted to a cluster significance threshold of P < 0.05. [Color figure can be viewed in the online issue, which is available at http://wileyonlinelibrary.com.]