
Figure 2.
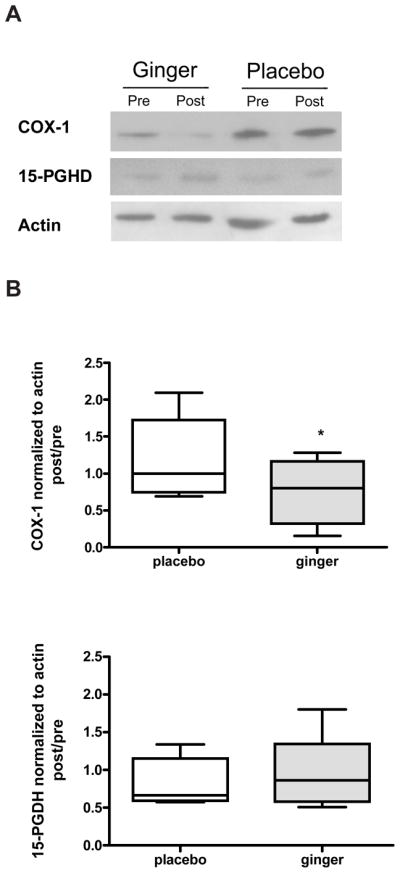
COX-1 and 15-PGDH protein expressions in colon biopsies from high CRC participants. Representative immunoblots of COX-1, 15-PGDH and actin protein level are shown (A). The quantification of the immunoblots is shown for COX-1 (top panel) and 15-PGDH (bottom panel). Values are expressed as ratio of post/pretreatment for COX-1or 15-PGDH protein/actin protein for each participant with high risk of CRC. Results are expressed as mean ± SEM (n = 10 in both placebo and ginger groups).