Abstract
Purpose
Evaluate the soft tissue change of the upper airway after maxillomandibular advancement (MMA) by computational fluid dynamics (CFD).
Materials and Methods
Eight OSAS patients who required MMA were recruited into this study. All participants had pre- and post-operative computed tomography (CT) and underwent MMA by a single oral and maxillofacial surgeon. Upper airway CT data sets for these 8 participants were created with high-fidelity 3-D numerical models for computational fluid dynamics (CFD). The 3-D models were simulated and analyzed to study how changes in airway anatomy affects pressure effort required for normal breathing. Airway dimensions, skeletal changes, Apnea-Hypopnea Index (AHI), and pressure efforts of pre- and post-operative 3-D models were compared and correlations interpreted.
Results
After MMA, laminar and turbulent air flow was significantly decreased at every level of the airway. The cross-sectional areas at the soft palate and tongue base were significantly increased.
Conclusions
This study shows that MMA increases airway dimensions by the increasing the occipital base (Base) - pogonion (Pg) distance. An increase of the Base-Pg distance showed a significant correlation with an AHI improvement and a decreased pressure effort of the upper airway. Decreasing the pressure effort will decrease the breathing workload. This improves the condition of OSAS.
Keywords: obstructive sleep apnea syndrome (OSAS), sleep apnea, computational fluid dynamics (CFD), mesh generation, maxillomandibular advancement (MMA), image processing, hybrid meshes, computed tomography (CT)
Introduction
Maxillomandibular advancement (MMA) is one of various surgical procedures that are currently offered for treating obstructive sleep apnea syndrome (OSAS).1 To effectively treat OSAS, it is important to detect the severity and site of obstruction in each patient. Few studies2–4 have looked at the correlation between airway anatomy and disease severity in effort to guide treatment and predict outcome. However, it is difficult to do this reliably. There are several upper airway imaging modalities,2–7 including nasopharyngoscopy, cephalometrics, computed tomography (CT), and magnetic resonance imaging (MRI). These imaging techniques have previously been used to study the changes in respiration and the upper airway from weight loss, dental appliances, and surgery. MRI and CT have allowed for quantification of the airway and surrounding soft-tissue structures in three dimensions.1, 4–25 Imaging studies provide significant insight into the bone and soft-tissue structure during wakefulness.16–23 However, it is still difficult to predict the surgical skeletal change needed to open the airway during sleep in OSAS patients.
In this study, the posterior airway space in patients with OSAS before and after MMA were analyzed with 3-D models and computational fluid dynamics (CFD). Changes in cross-sectional area and pressure effort between pre- and post-operative MMA patients were compared and discussed.
Materials and Methods
The study was approved by the University of Alabama at Birmingham Institutional Review Board. Twenty three patients who were diagnosed with OSAS by the UAB Sleep/Wake Disorders Center and received MMA were recruited in this study during 2006–2008. Recruiting criteria included completion of a polysomnographic study prior to surgery, and again within 6 months following surgery. A standardized helical CT scan with the patient’s trago-canthal line perpendicular to the ground during the end of expiration was performed at 1-month preoperative and 6-months postoperative (Figure 1). All subjects underwent a full night, attended, diagnostic polysomnogram. Polysomnography evaluation included airflow monitoring with thermocouple and/or nasal pressure, respiratory effort using piezo belts at the chest and abdominal positions, oxygen saturation using pulse oximetry, heart rate using a 2-lead electrocardiogram, electroencephalogram (C4-A1, C3-A2, O2-A1, O1-A2), submental and tibial electromyograms, and bilateral electrooculograms. Apnea was defined as a cessation in airflow of at least 10 seconds. Hypopnea was defined as a reduction in the amplitude of a decrease in oxygen saturation of 4%, or signs of physiologic arousal (at least 3 s of α activity). The apnea-hypopnea index (AHI) was calculated as the total number of apneas plus hypopneas divided by the hours of sleep. Sleep was staged according to criteria of Rechtschaffen and Kales.26 The scoring of all studies was confirmed by an American Board of Sleep Medicine diplomat blinded to the biochemical assessment. OSAS was defined as an AHI of at least 5 per hour.
Figure 1.
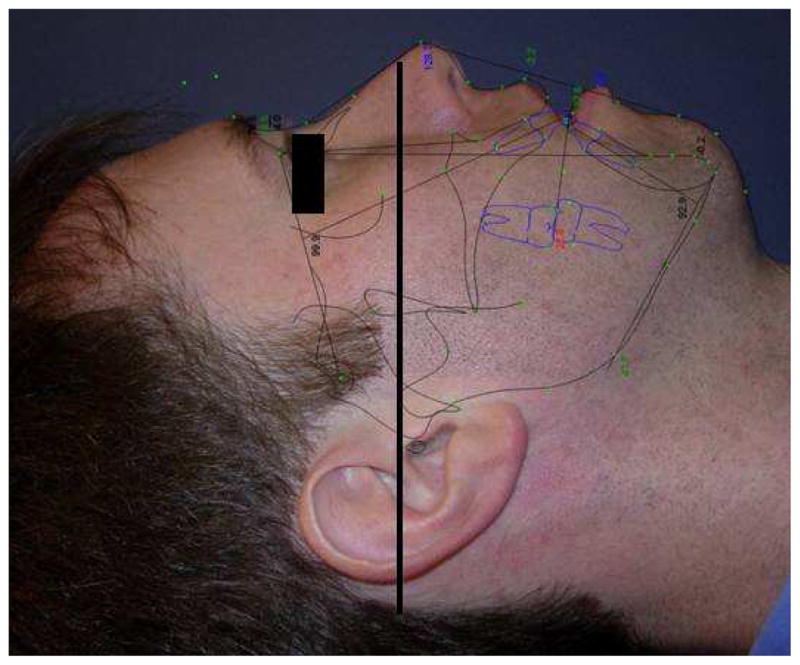
This picture shows the trago-canthal line which is drawn from the tragus to the infra-orbital rim for the reference of head position during performing facial CT scans. Head position during CT scan, aligns the trago-canthal line perpendicular to the floor.
At the beginning, 23 patients with mild-to-severe OSAS were considered for recruiting into this study. Fifteen patients were excluded from this study due to poor head position or complete airway collapse on the preoperative CT. The pressure effort cannot be calculated by CFD simulation of a completely obstructed airway because there is no air flow passing through the upper airway. Therefore, eight patient CT data sets with mild-to-severe OSAS were recruited into this study. These eight patients were labeled Cases #1, 5, 6, 12, 13, 18, 19 and 23. Geometric reconstruction and mesh generation was produced using data sets of pre- and postoperative facial CT scans of the eight OSAS patients. Pre- and post-operative CT scans of the airway were analyzed measuring the antero-posterior and lateral airway dimensions. The level of airway was divided into six levels, each 10 mm apart, starting at the hard palate (level 1) extended caudally for 60 mm (level 6) (Figure 2).
Figure 2.
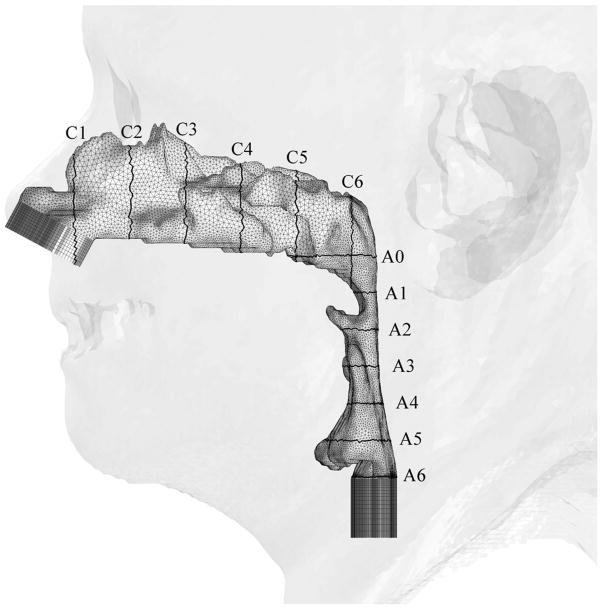
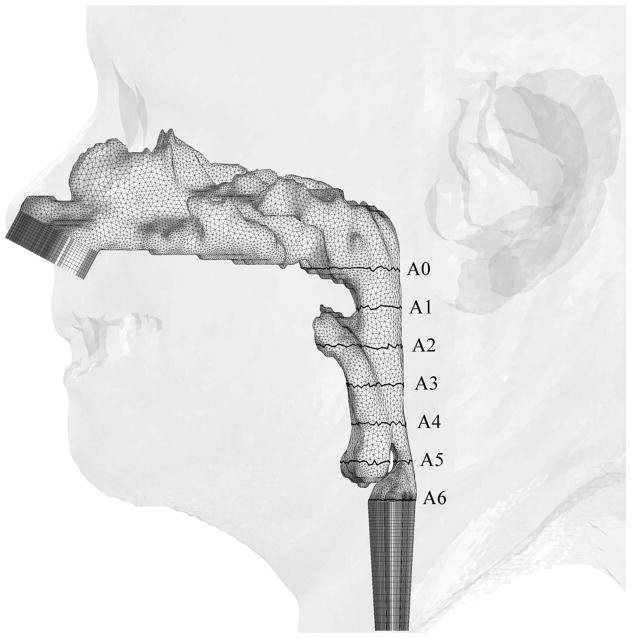
Illustrations of hybrid meshes generated for Case 12 (a) pre- and (b) postoperative upper airway models with postoperative skin as reference and black lines showing positions of cross-sections. C1-C6 are coronal cross-sections of the hybrid mesh; while A0-A6 are axial cross-sections of hybrid meshes shown in Figure 3.
Pre- and post-operative skeletal changes were measured by CT in parallel to the Frankfort horizontal plane. Anatomical measurements were from the posterior border of foramen magnum at occipital base (Base) to the points A, B and Pg (A (subspinale) = the point of greatest concavity of the maxilla between anterior nasal spine and maxillary dental alveolus, B (supramentale) = the point of greatest concavity of the mandible between mandibular dental alveolus and pogonion, and Pg (pogonion) = the most anterior point on the mandibular symphysis). These measurements were made twice and the values were averaged by the same mechanical engineer and not by cephalometric assessment.
To extract patient-specific airway geometries from CT data, the Insight Segmentation and Registration Toolkit (ITK)27 and the Visualization Toolkit (VTK),28 were utilized at the Computer Enabling Technology Laboratory (ETLab), School of Engineering, University of Alabama at Birmingham. The airway dimensions (diameter, area, and volume in different levels) of pre- and post-operative MMA were recorded and compared. The numerical meshes employed for each case have similar grid spacing, and thus the number of computational cells varies with the size of the airway simulated. The laminar and turbulent CSF simulations were conducted for the high-fidelity 3-D models constructed based on the patient-specific CT data to predict the flow field in the nasal and upper airway of 8 patients before and after MMA. For numerical simulations, an inlet air pressure was set to be ambient pressure (1 atm), and a normal air volume flow rate (an averaged volume of air for one normal inspiration) of 700 mL/s for adults was used to calculate the speed of air entering the nose since steady air flow (instead of dynamic tidal air flow) was used in calculating the flow field and pressure efforts in this study. The air flow was simulated with the same amount of air inspired in every case.
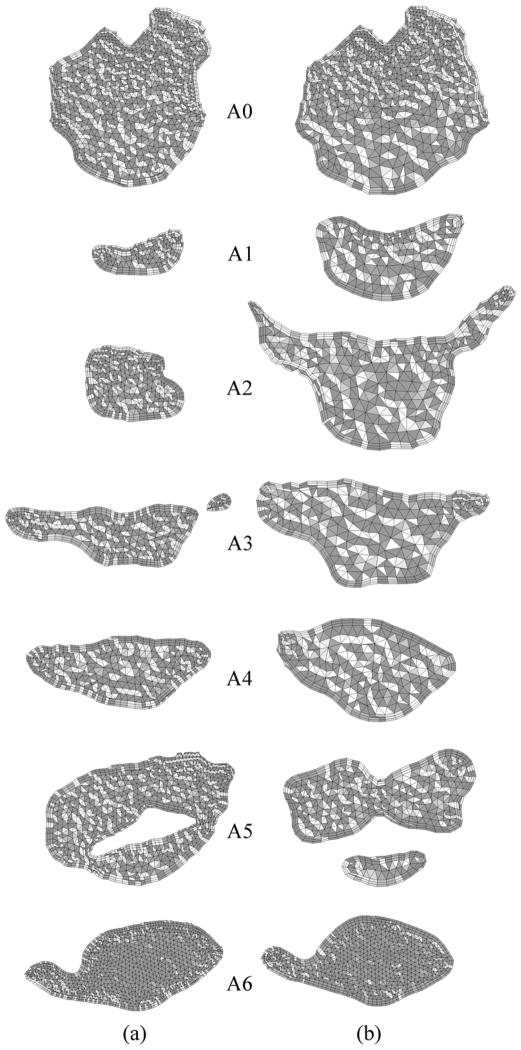
In our study, two finite-volume CFD codes; a pressure-based UNIC code29 and a density-based HYB3D code30, 31 were employed to simulate the flow in the nasal and upper airway. Both CFD codes solve a set of discretized equations governing the type of fluid flows of interest. These equations include the continuity, momentum, energy equations, and the turbulence transport equation, if turbulent flow is simulated. The computational domain of interest (the nasal and upper airway in this case) is also discretized with a mesh consisting of numerous grid points, where a larger number of grid points, in general, represents higher resolution and a better numerical accuracy. A set of dependent variables (unknowns), such as velocity components, density, pressure, energy, and temperature, is then calculated by solving the set of governing equations over each grid points. Since typically there are more dependent variables than the governing equations solved, the equations of state are commonly employed to correlate density, pressure, energy and temperature so that the number of the equations match that of the dependent variables. For the pressure-based flow solver, pressure is solved as one of the dependent variables, while density is solved as one of the dependent variables for the density-based flow solver. For the numerical calculations with the UNIC code, the mass flow rate was specified and fixed at nasal the inlet, and conservation of mass was used to calculate the pressure at the exit boundary. Whereas, the air velocity was specified and fixed at the inlet boundary, the pressure was specified at the exit boundary, and the pressure at the inlet plane was calculated as an unknown in numerical simulations with the HYB3D code. Since the air was assumed to be incompressible (fixed inlet mass flow rate is equivalent to fixed inlet velocity), these two sets of boundary conditions have the same mathematical implication for the pressure effort. The pressure effort (ΔP) defined as the difference between the pressure at different locations along the airway at the cross-section with the base plane (Plane A0 –A6) through the hard palate (Figure 3).32 The airflow resistance was used as a measure to assess the surgical outcome. Both pre- and postoperative models of upper airways were simulated to assess the MMA surgical effect.
Figure 3.
Axial cross-sections of hybrid meshes generated for Case # 12 (a) pre- and (b) postoperative upper airway models.
The correlations between AHI, airway dimensions, pre- and post-operative MMA airflow properties were analyzed with statistics. Mixed-model analysis of variance (ANOVA) was used to compare pre- and post-operative changes in area. Pairwise comparisons among levels were conducted using Turkey’s test when a significant overall difference was found. Pre- and postoperative MMA changes of within-subject mean AHI were evaluated by paired t test. Mean AHI change was compared between males and females by t test. Associations between patient-level variables and mean AHI change were characterized using Spearman’s rank correlation coefficient.
Results
Pre- and post-operative upper airway models were created for all OSAS cases from clinically-used CT data sets to perform viscous CFD simulations. The numerical results demonstrated computational geometry, mesh generation and CFD simulations. Four patients were females and four were males. Mean AHI change was −26.3 (standard deviation = 11.86). All of the MMA patients (Case # 1, 5, 6, 12, 13, 18, 19 and 23) showed increased airway cross-sectional area and decreased pressure effort at every airway level after MMA. All these patients had AHI improved after MMA. There was no correlation or difference between genders and all variations including distance of facial bone movement (from Base to the points A, B and Pg), percent area of the airway changes, pressure efforts, BMI and AHI.
There was a significant correlation between the distance of the jaw movement (Table 1) from Pg to Base point and AHI (Spearman’s rho = −0.83, p < 0.01). There was no significant correlation between the distance of the jaw movement (skull base to point A and B) and AHI (Spearman’s rho = −0.26, p < 0.53 and Spearman’s rho = −0.64, p < 0.08 respectively).
Table 1.
The skeletal facial bone changes were measured horizontally parallel to the Frankfort horizontal plane from the posterior border of foramen magnum at occipital base (Base) to the points A, B and Pg and compared between pre- and post-operative MMA.
| Case | Op | AHI | Distance for jaw movement [mm] | |||||
|---|---|---|---|---|---|---|---|---|
| Average A - Base | Difference between pre- and post-op | Average B - Base | Difference between pre- and post-op | Average Pg - Base | Difference between pre- and post-op | |||
| 1 | Pre | 22.6 | 114.57 | 3.95 | 113.39 | 6.44 | 119.23 | 7.23 |
| post | 9.7 | 118.52 | 119.83 | 126.46 | ||||
| 5 | Pre | 38 | 123.59 | 9.41 | 122.58 | 9.9 | 135.88 | 10.34 |
| post | 8.2 | 133 | 132.48 | 146.22 | ||||
| 6 | Pre | 17.1 | 120.93 | 6.36 | 125.54 | 6.82 | 131.93 | 5.61 |
| post | 5.4 | 127.29 | 132.36 | 137.54 | ||||
| 12 | Pre | 14 | 121.61 | 6.17 | 121.45 | 4.92 | 126.37 | 4.52 |
| post | 0.7 | 127.78 | 126.37 | 130.89 | ||||
| 13 | Pre | 50 | 124.25 | 4.95 | 123.38 | 12.5 | 131.15 | 10.59 |
| post | 13 | 129.2 | 135.88 | 141.74 | ||||
| 18 | Pre | 40.3 | 140.91 | 7.62 | 139.18 | 11.24 | 149.32 | 14.53 |
| post | 6 | 148.53 | 150.42 | 163.85 | ||||
| 19 | Pre | 48 | 121.96 | 7.51 | 120.55 | 8.48 | 127.64 | 12.97 |
| post | 7 | 129.47 | 129.03 | 140.61 | ||||
| 23 | Pre | 30.9 | 132.93 | 10.32 | 141.52 | 8.86 | 149.02 | 9.15 |
| post | 0.5 | 143.25 | 150.38 | 158.17 | ||||
The maximum changes of laminar and turbulent pressures were significantly correlated to each other (p < 0.0001). The percent maximum change of laminar pressure (pctMax-ΔP LamChange) and percent maximum change of turbulent pressure (pctMax-ΔP TurbChange) was almost perfectly correlated (rho = 0.976 and p < 0.0001), so these two results were not distinct. The percent area change of the airway after MMA had a significant improvement and correlation with the pctMax-ΔP LamChange (p < 0.0009) and pctMax-ΔP TurbChange (p < 0.0003). There was no correlation between the percent area changes of the airway and lamina/turbulent pressure (p < 0.05).
There were significant pre-postoperative increases in area for levels 0, 10, 20 and 30 mm (p = 0.0078, for each, by signed rank test). For the change in area, the largest mean occurred at the 30 mm level (mean = 180.75, standard deviation = 158.55). However, the mean area changes were not significantly different among the levels, p = 0.2616 (Table 2).
Table 2.
Predicted pressure efforts at the different locations along the pre- and postoperative upper airways (Op: operative, ΔP: pressure effort and has a unit of mm H2O; Area: cross-sectional area of the airway and has a unit of mm2; Pre: preoperative; Post: postoperative; Lam.: laminar flow; Turb.: turbulent flow).
| Case | Op | AHI | 0mm | l0mm | 20mm | 30mm | 40mm | 50mm | ||||||||||||
|---|---|---|---|---|---|---|---|---|---|---|---|---|---|---|---|---|---|---|---|---|
| Area | ΔP (mm H2O) | Area | ΔP (mm H2O) | Area | ΔP (mm H2O) | Area | ΔP (mm H2O) | Area | ΔP (mm H2O) | Area | ΔP (mm H2O) | |||||||||
| Lam. | Turb. | Lam. | Turb. | Lam. | Turb. | Lam. | Turb. | Lam. | Turb. | Lam. | Turb. | |||||||||
| 1 | Pre | 22.6 | 513 | 0 | 0 | 116 | −0.3 | −1.1 | 61 | −1.7 | −3.7 | 45 | −3.9 | −8.7 | 46 | −7.5 | −8.4 | 66 | −6.0 | −6.8 |
| post | 9.7 | 521 | 0 | 0 | 158 | −0.2 | −0.5 | 146 | −0.4 | −0.6 | 144 | −0.3 | −0.7 | 125 | −0.6 | −1.0 | 130 | −0.8 | −1.5 | |
| 5 | Pre | 38.0 | 515 | 0 | 0 | 88 | −1.0 | −1.8 | 77 | −3.5 | −3.6 | 183 | −2.8 | −3.3 | 146 | −2.8 | −2.5 | 166 | −2.3 | −2.5 |
| post | 8.2 | 632 | 0 | 0 | 410 | 0.0 | 0.0 | 502 | 0.0 | 0.0 | 490 | 0.0 | 0.0 | 719 | 0.0 | 0.0 | 652 | 0.0 | 0.0 | |
| 6 | Pre | 17.1 | 231 | 0 | 0 | 57 | −5 | −5 | 4 | −1128 | −1165 | 114 | −1273 | −1283 | 114 | −1275 | −1288 | 14 | −1308 | −1297 |
| post | 5.4 | 289 | 0 | 0 | 111 | −0.6 | −1.0 | 57 | −2.6 | −3.7 | 176 | −2.8 | −3.5 | 51 | −2.6 | −6.7 | 74 | −8.9 | −7.8 | |
| 12 | Pre | 14.0 | 366 | 0 | 0 | 45 | −1.2 | −7.3 | 105 | −6.6 | −6.1 | 151 | −5.9 | −6.1 | 171 | −5.5 | −6.3 | 298 | −5.8 | −6.8 |
| post | 0.7 | 451 | 0 | 0 | 163 | 0.0 | −0.3 | 337 | 0.0 | −0.2 | 282 | 0.0 | −0.3 | 225 | 0.0 | −0.3 | 43 | −1.1 | −13.0 | |
| 13 | Pre | 50.0 | 160 | 0 | 0 | 24 | −11 | −22 | 20 | −35 | −38 | 145 | −26 | −28 | 218 | −25 | −28 | 175 | −24 | −28 |
| post | 13.0 | 403 | 0 | 0 | 137 | −0.3 | −0.7 | 91 | −1.1 | −1.7 | 191 | −1.3 | −1.5 | 178 | −0.8 | −1.0 | 242 | −0.9 | −1.6 | |
| 18 | Pre | 40.3 | 626 | 0 | 0 | 232 | 0.0 | −0.1 | 119 | −0.1 | −0.8 | 76 | −1.2 | −2.1 | 176 | −1.9 | −1.8 | 259 | −1.2 | −1.8 |
| post | 6.0 | 738 | 0 | 0 | 507 | 0.0 | 0.0 | 411 | 0.0 | 0.0 | 529 | 0.0 | 0.0 | 525 | 0.1 | 0.0 | 512 | 0.1 | 0.0 | |
| 19 | Pre | 48.0 | 471 | 0 | 0 | 70 | −6.0 | −5 | 22 | −53 | −48 | 17 | −52 | −39 | 9 | −273 | −252 | 43 | −136 | −129 |
| post | 7.0 | 476 | 0 | 0 | 165 | −0.3 | −0.5 | 78 | −1.7 | −2.4 | 42 | −2.7 | −4.0 | 58 | −4.0 | −5.4 | 78 | −3.4 | −4.6 | |
| 23 | Pre | 30.9 | 186 | 0 | 0 | 106 | −0.6 | −0.6 | 102 | −0.3 | −0.9 | 207 | −0.4 | −0.7 | 213 | −0.1 | −0.6 | 196 | 0.1 | −0.6 |
| post | 0.5 | 346 | 0 | 0 | 280 | 0.0 | 0.0 | 295 | 0.2 | 0.0 | 530 | 0.2 | 0.0 | 490 | 0.2 | 0.0 | 411 | 0.2 | 0.0 | |
There was a significant difference in mean pre-postoperative change in laminar pressure change (ΔP Lam) among the levels (p = 0.0067, by mixed-model ANOVA using rank transformation), with the 10 mm level showing significantly less change, on average, than levels 20 mm, 30 mm and 40 mm (Tukey’s test). Mean pre-postoperative change in turbulent pressure change (ΔP Turb) differed significantly among the levels (p = 0.0003, by mixed-model ANOVA using rank transformation), due to the 10 mm level showing a significantly lower mean than the 20mm level, with no other significant differences (Tukey’s test). For the change in ΔP Lam and ΔP Turb, the largest mean was at the 40 mm level (tongue base). However, the difference in mean change among the levels was not significant.
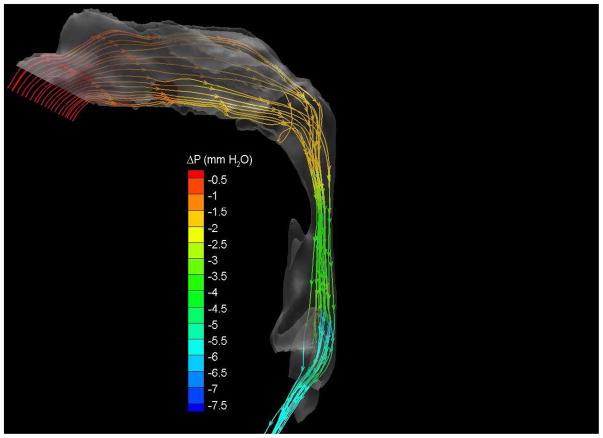
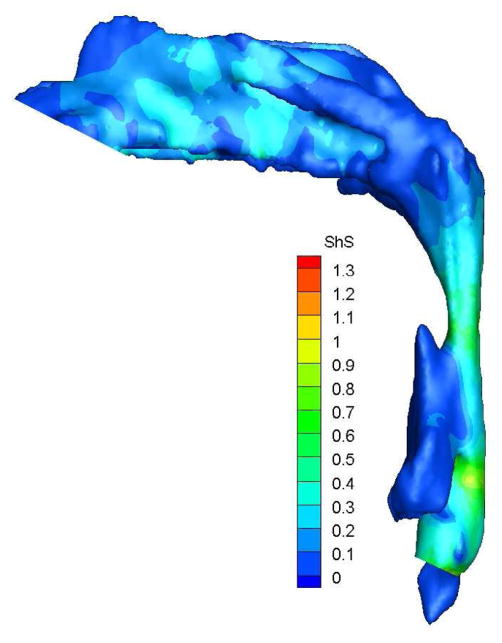
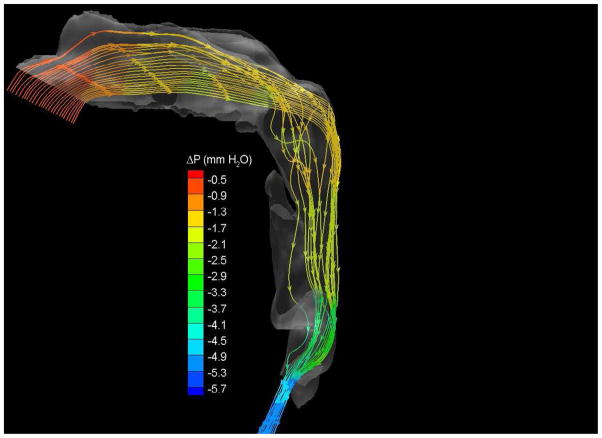
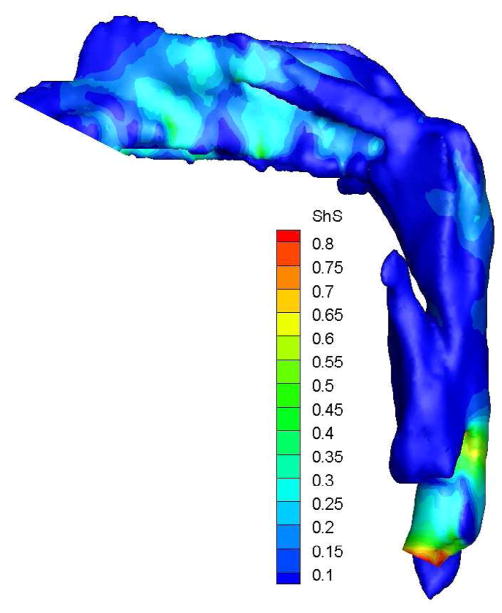
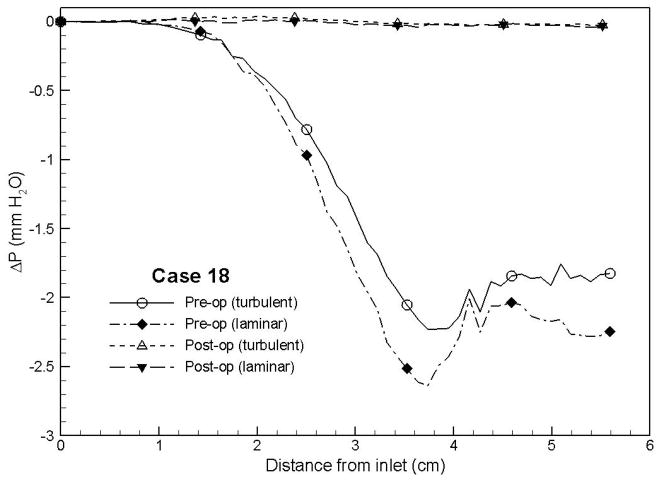
To demonstrate the flow characteristics in the upper airway, the numerical results of case# 18 was plotted in Figures 4, which showed the contours of pressure efforts and shear stresses at the flow-airway interface and the streamline traces of the airflow through each upper airway. Colors used to indicate the magnitude of the pressure effort in millimeters of water range from red (for the lowest effort) to blue (for the highest effort). Whereas, for the shear stress contours (in N/m2), red indicated the largest friction and blue indicated the smallest friction. It could be seen that the higher pressure effort occurs at the location with the narrower airway passage which corresponds to higher air flow velocity and larger friction. The numerical results of other cases were presented in our earlier paper33, which demonstrate similar qualitative trends to those stated above.
Figure 4.
Case # 18; pre- and postoperative streamline traces and shear stress contour of turbulent airflow. The streamline traces (A) and shear stress contours (B) in the preoperative upper airway showed higher pressure efforts and shear stress than the postoperative ones (C and D, respectively) in every patient. Color of the airflow determines the level of the pressure gradient (mmH2O) and shear stress (N/m2). Postoperative pressure efforts (ΔP Lam and ΔP Turb) were decreased after MMA (E). These postoperative outcomes were consistent with other patients (Case # 1, 5, 6, 12, 13, 19 and 23).
Figure 4 with captions for figures as following
(a) Preoperative streamline traces
(b) Preoperative Shear stress
(c) Postoperative streamline traces
(d) Postoperative shear stress
(e) Case# 18: Comparison of pressure effort distributions along the pre- and postoperative upper airways.
Discussion
In general, higher degrees of airway obstruction will require more pressure efforts (ΔP Lam and ΔP Turb) to inspire the normal amount of air with more workload of breathing. On the other hand, increasing airway dimension (space or volume) should reduce the pressure effort or workload of breathing. This concept supports the use of MMA for treatment of OSAS. In this study, MMA has shown to significantly increase the airway cross-sectional area at levels 0, 10, 20, 30 mm (oropharyngeal area). The greatest change was seen at the 30 mm level. This study shows that MMA can decrease the ΔP Lam and ΔP Turb, and had the most impact at the 40 mm level (tongue base). MMA protrudes the mandible and chin to increase airway dimensions. This was measured and represented by the increase in the Base-Pg distance. An increase in the Base-Pg distance showed a significant correlation with AHI improvement and decreased the pressure effort (ΔP Lam and ΔP Turb) at each level of the upper airway. A decrease in pressure effort (ΔP Lam and ΔP Turb) will decrease the workload of breathing. These results correlate clinically to improvement of OSAS. Therefore, MMA surgery has shown to help obstructive sleep apnea patients breathe easier and with less effort. The increase of the airway volume is a direct result of MMA surgery, and the region around the tongue base increased the most.
This study demonstrates the possibility of computational fluid dynamics in providing information for understanding the pathogenesis of OSAS and could predict the outcome of surgeries for airway modification in OSAS. Sung et al34 stated the similar results of CFD analyses on airway CT data of OSAS patients. In addition, our study shows the airflow resistance of the airway is decreased by MMA and less breathing effort is required in the postoperative airway. Yu et al35 reported these same outcomes of MMA for OSAS. Not only MMA increases the dimensions of the upper airway in OSAS but postoperative airway is also less prone to collapse. We acknowledge the effects of awake subjects, static airway models and neural compensatory reflexes as an important limitation in our study for CFD. Progressive airway narrowing has been observed in OSAS adults during expiration and inspiration.36 The rigidity in imaging and modeling decrease the value of movement and compliance of the soft tissue of the airway.
All OSAS patients in this study after MMA had improved AHI (decreased). The AHI, however, was not significantly correlated with other parameters, including airway cross-sectional area, and pressure efforts (ΔP Lam and ΔP Turb). Recruiting more OSAS participants for computational fluid dynamics using flexible models should be considered for future studies.
Acknowledgments
This research is supported by the National Institute of Dental and Craniofacial Research (NIDCR) at the National Institutes of Health (NIH) No. 5R21DE017613-02.
Footnotes
Publisher's Disclaimer: This is a PDF file of an unedited manuscript that has been accepted for publication. As a service to our customers we are providing this early version of the manuscript. The manuscript will undergo copyediting, typesetting, and review of the resulting proof before it is published in its final citable form. Please note that during the production process errors may be discovered which could affect the content, and all legal disclaimers that apply to the journal pertain.
References
- 1.Waite PD, Wooten V, Lachner J, Guyette RF. Maxillomandibular advancement surgery in 23 patients with obstructive sleep apnea syndrome. J Oral Maxillofac Surg. 1989;47(12):1256–61. doi: 10.1016/0278-2391(89)90719-2. discussion 62. [DOI] [PubMed] [Google Scholar]
- 2.Faber CE, Grymer L. Available techniques for objective assessment of upper airway narrowing in snoring and sleep apnea. Sleep Breath. 2003;7(2):77–86. doi: 10.1007/s11325-003-0077-9. [DOI] [PubMed] [Google Scholar]
- 3.Metes A, Hoffstein V, Direnfeld V, Chapnik JS, Zamel N. Three-dimensional CT reconstruction and volume measurements of the pharyngeal airway before and after maxillofacial surgery in obstructive sleep apnea. J Otolaryngol. 1993;22(4):261–4. [PubMed] [Google Scholar]
- 4.Schwab RJ. Upper airway imaging. Clin Chest Med. 1998;19(1):33–54. doi: 10.1016/s0272-5231(05)70430-5. [DOI] [PubMed] [Google Scholar]
- 5.Pepin JL, Ferretti G, Veale D, et al. Somnofluoroscopy, computed tomography, and cephalometry in the assessment of the airway in obstructive sleep apnoea. Thorax. 1992;47(3):150–6. doi: 10.1136/thx.47.3.150. [DOI] [PMC free article] [PubMed] [Google Scholar]
- 6.Schwab RJ, Goldberg AN. Upper airway assessment: radiographic and other imaging techniques. Otolaryngol Clin North Am. 1998;31(6):931–68. doi: 10.1016/s0030-6665(05)70100-6. [DOI] [PubMed] [Google Scholar]
- 7.Hoffman EA, Gefter WB. Multimodality imaging of the upper airway: MRI, MR spectroscopy, and ultrafast X-ray CT. Prog Clin Biol Res. 1990;345:291–301. [PubMed] [Google Scholar]
- 8.Conradt R, Hochban W, Brandenburg U, Heitmann J, Peter JH. Long-term follow-up after surgical treatment of obstructive sleep apnoea by maxillomandibular advancement. Eur Respir J. 1997;10(1):123–8. doi: 10.1183/09031936.97.10010123. [DOI] [PubMed] [Google Scholar]
- 9.Nimkarn Y, Miles PG, Waite PD. Maxillomandibular advancement surgery in obstructive sleep apnea syndrome patients: long-term surgical stability. J Oral Maxillofac Surg. 1995;53(12):1414–8. doi: 10.1016/0278-2391(95)90667-3. discussion 18–9. [DOI] [PubMed] [Google Scholar]
- 10.Riley RW, Powell NB. Maxillofacial surgery and obstructive sleep apnea syndrome. Otolaryngol Clin North Am. 1990;23(4):809–26. [PubMed] [Google Scholar]
- 11.Shepard JW, Jr, Gefter WB, Guilleminault C, et al. Evaluation of the upper airway in patients with obstructive sleep apnea. Sleep. 1991;14(4):361–71. doi: 10.1093/sleep/14.4.361. [DOI] [PubMed] [Google Scholar]
- 12.Turnbull NR, Battagel JM. The effects of orthognathic surgery on pharyngeal airway dimensions and quality of sleep. J Orthod. 2000;27(3):235–47. doi: 10.1179/ortho.27.3.235. [DOI] [PubMed] [Google Scholar]
- 13.Ozuki T, Ohkubo Y, Abe K. Measurement of the square measure of the pharynx and the positional diagnosis of airway obstruction during obstructive sleep apnea syndrome by dynamic MRI. Nippon Igaku Hoshasen Gakkai Zasshi. 2000;60(13):752–8. [PubMed] [Google Scholar]
- 14.Shintani T, Kozawa T, Himi T. Obstuctive sleep apnea by analysis of MRI findings. International Congress Series. 2003;1257:99–102. [Google Scholar]
- 15.Weese-Mayer DE, Brouillette RT, Naidich TP, McLone DG, Hunt CE. Magnetic resonance imaging and computerized tomography in central hypoventilation. Am Rev Respir Dis. 1988;137(2):393–8. doi: 10.1164/ajrccm/137.2.393. [DOI] [PubMed] [Google Scholar]
- 16.Morrison DL, Launois SH, Isono S, et al. Pharyngeal narrowing and closing pressures in patients with obstructive sleep apnea. Am Rev Respir Dis. 1993;148(3):606–11. doi: 10.1164/ajrccm/148.3.606. [DOI] [PubMed] [Google Scholar]
- 17.Isono S, Morrison DL, Launois SH, et al. Static mechanics of the velopharynx of patients with obstructive sleep apnea. J Appl Physiol. 1993;75(1):148–54. doi: 10.1152/jappl.1993.75.1.148. [DOI] [PubMed] [Google Scholar]
- 18.Isono S. Diagnosis of sites of upper airway obstruction in patients with obstructive sleep apnea. Nippon Rinsho. 2000;58(8):1660–4. [PubMed] [Google Scholar]
- 19.Isono S, Feroah TR, Hajduk EA, et al. Interaction of cross-sectional area, driving pressure, and airflow of passive velopharynx. J Appl Physiol. 1997;83(3):851–9. doi: 10.1152/jappl.1997.83.3.851. [DOI] [PubMed] [Google Scholar]
- 20.Isono S, Remmers JE, Tanaka A, et al. Anatomy of pharynx in patients with obstructive sleep apnea and in normal subjects. J Appl Physiol. 1997;82(4):1319–26. doi: 10.1152/jappl.1997.82.4.1319. [DOI] [PubMed] [Google Scholar]
- 21.Isono S, Shimada A, Utsugi M, Konno A, Nishino T. Comparison of static mechanical properties of the passive pharynx between normal children and children with sleep-disordered breathing. Am J Respir Crit Care Med. 1998;157(4 Pt 1):1204–12. doi: 10.1164/ajrccm.157.4.9702042. [DOI] [PubMed] [Google Scholar]
- 22.Isono S, Tanaka A, Tagaito Y, Sho Y, Nishino T. Pharyngeal patency in response to advancement of the mandible in obese anesthetized persons. Anesthesiology. 1997;87(5):1055–62. doi: 10.1097/00000542-199711000-00008. [DOI] [PubMed] [Google Scholar]
- 23.Launois SH, Feroah TR, Campbell WN, et al. Site of pharyngeal narrowing predicts outcome of surgery for obstructive sleep apnea. Am Rev Respir Dis. 1993;147(1):182–9. doi: 10.1164/ajrccm/147.1.182. [DOI] [PubMed] [Google Scholar]
- 24.Saeki N, Isono S, Tanaka A, et al. Pre-and post-operative respiratory assessment of acromegalics with sleep apnea--bedside oximetric study for transsphenoidal approach. Endocr J. 2000;47 (Suppl):S61–4. doi: 10.1507/endocrj.47.supplmarch_s61. [DOI] [PubMed] [Google Scholar]
- 25.Watanabe T, Isono S, Tanaka A, Tanzawa H, Nishino T. Contribution of body habitus and craniofacial characteristics to segmental closing pressures of the passive pharynx in patients with sleep-disordered breathing. Am J Respir Crit Care Med. 2002;165(2):260–5. doi: 10.1164/ajrccm.165.2.2009032. [DOI] [PubMed] [Google Scholar]
- 26.Novelli L, Ferri R, Bruni O. Sleep classification according to AASM and Rechtschaffen and Kales: effects on sleep scoring parameters of children and adolescents. J Sleep Res. 2010;19(1 Pt 2):238–47. doi: 10.1111/j.1365-2869.2009.00785.x. [DOI] [PubMed] [Google Scholar]
- 27.Insight Segmentation and Registration Toolkit (ITK) doi: 10.1109/IEMBS.2007.4352434. http://www.itk.org/ [DOI] [PubMed]
- 28.Schroeder W, Martin K, Lorensen B. The Visualization Toookit. Kitware, Inc; 2004. [Google Scholar]
- 29.Chen YS. An Unstructured Finite Volume Method for Viscous Flow Computations. Paper presented at: 7th International Conference on Finite Element Methods in Flow Problems; Feb. 3–7, 1989; Huntsville, Alabama: University of Alabama in Huntsville; [Google Scholar]
- 30.Koomullil RP, Soni BK. Flow Simulation Using Generalized Static and Dynamics Grids. AIAA. 1999;37(12):1551–57. [Google Scholar]
- 31.Koomullil RP, Thompson DS, Soni BK. Iced Airfoil Simulation Using Generalized Grids. Journal of Applied Numerical Mathematics. 2003;46(3–4):319–30. [Google Scholar]
- 32.Ito Y, Cheng GC, Shih AM, et al. Patient-Specific Geometry Modeling and Mesh Generation for Simulating Obstructive Sleep Apnea Syndrome Cases by Maxillomandibular Advancement. Math Comput Simul. 2011;81(9):1876–91. doi: 10.1016/j.matcom.2011.02.006. [DOI] [PMC free article] [PubMed] [Google Scholar]
- 33.Cheng GCKR, Ito Y, Shih AM, Sittitavornwong S, Waite P. Numerical Study of Surgical Effects on Patients with Obstructive Sleep Apnea Syndrome Using Computational Fluid Dynamics. Mathematics and Computers in Simulation. doi: 10.1016/j.matcom.2012.11.008. in print. [DOI] [PMC free article] [PubMed] [Google Scholar]
- 34.Sung SJ, Jeong SJ, Yu YS, Hwang CJ, Pae EK. Customized three-dimensional computational fluid dynamics simulation of the upper airway of obstructive sleep apnea. Angle Orthod. 2006;76(5):791–9. doi: 10.1043/0003-3219(2006)076[0791:CTCFDS]2.0.CO;2. [DOI] [PubMed] [Google Scholar]
- 35.Yu CC, Hsiao HD, Lee LC, et al. Computational fluid dynamic study on obstructive sleep apnea syndrome treated with maxillomandibular advancement. J Craniofac Surg. 2009;20(2):426–30. doi: 10.1097/SCS.0b013e31819b9671. [DOI] [PubMed] [Google Scholar]
- 36.Morrell MJ, Arabi Y, Zahn B, Badr MS. Progressive retropalatal narrowing preceding obstructive apnea. Am J Respir Crit Care Med. 1998;158(6):1974–81. doi: 10.1164/ajrccm.158.6.9712107. [DOI] [PubMed] [Google Scholar]


