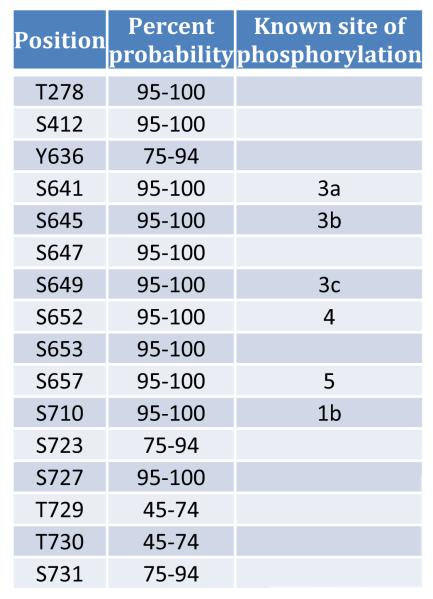
Fig. 5.
Post-translational modification mapping by LC/MS/MS for hGYS1. The complete amino acid sequence for hgys1 is shown with all peptides detected through database searches shaded as indicated in the peptide identification legend to the right. Phosphorylation sites are indicated with a ‘P’ above the modified residue(s) with color coded boxes shown to indicate the phosphorylation site probability range as determined by analysis with phosphoRS within Proteome Discoverer 1.3 (legend to the right). In addition, the phosphorylated residues which were detected by high confidence spectral mapping are listed to the left.

