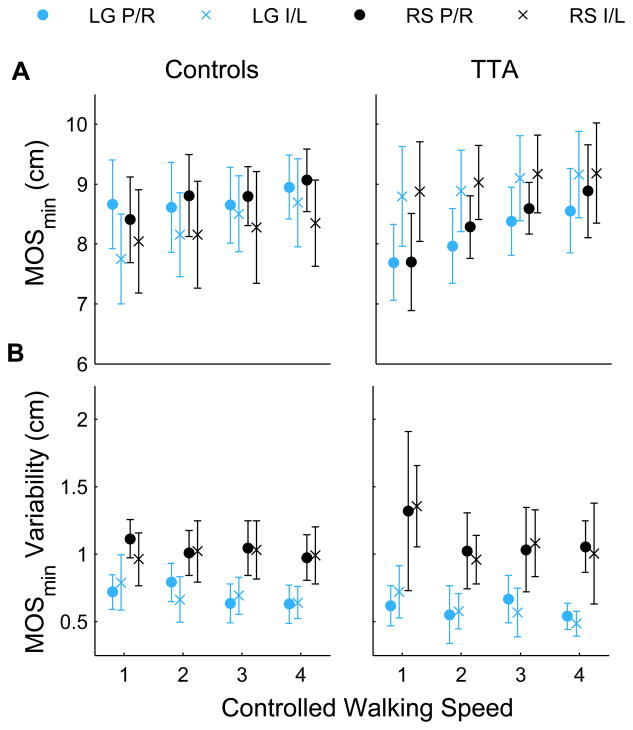
Figure 2. Margin of Stability.
Minimum margins of stability, MOSmin, and the within subject variability of MOSmin are shown for the control and TTA subjects. Data is shown for the rock surface (‘RS’) and level ground (‘LG’) at each of the four controlled walking speeds (shown from slowest to fastest). ‘×’ represent the right leg for the controls and the intact limb for the amputees. ‘○’ represent the left side for the controls and prosthetic limb for the amputees. Error bars represent ± 95 % confidence intervals about the mean.

