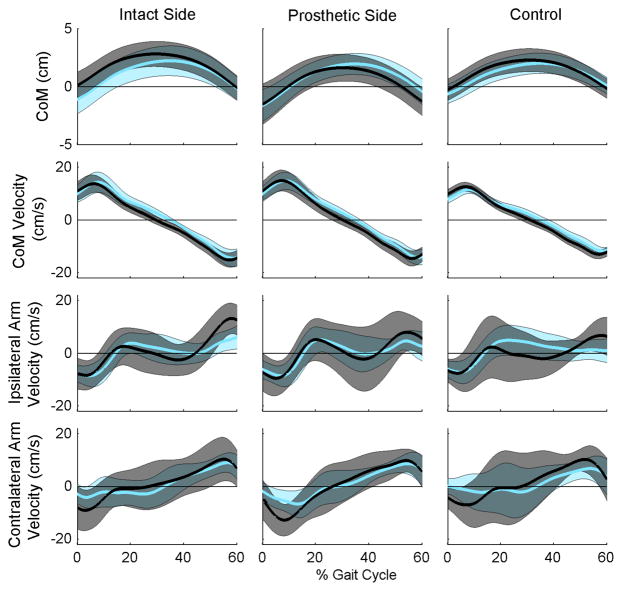
Figure 5. Center of Mass Movement and Arm Swing Velocity.
Lines represent the average behavior across subjects during walking overground (cyan) and on the rock surface (black) at controlled speed 3. Bands represent the standard deviation across subjects. Control data is shown for the right side only. Positive values are toward the stance limb, Left) Intact, Middle) Prosthetic, and Right) Right limb of control subjects.

