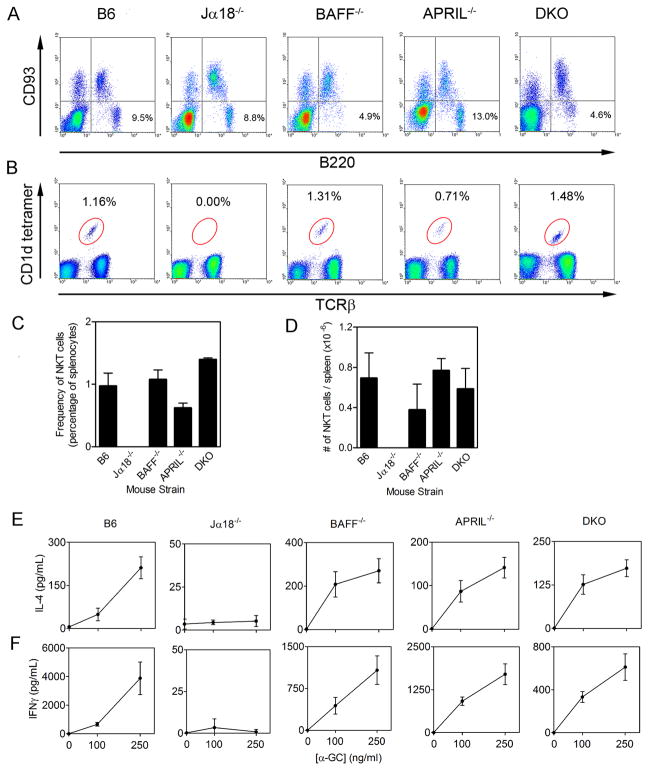
Figure 1. B cells and NKT cells in donor mice.
BM cells and splenocytes were harvested from the donor B6, Jα18−/−, BAFF−/−, APRIL−/− and DKO mice (n = 3–5 per group). (A) BM cells were analyzed by flow cytometry for B220+ versus CD93− mature B cells. (B) Splenocytes were analyzed by flow cytometry for TCRβ+ versus CD1d tetramer+ cells. (C) Shows mean ± SD frequency and (D) shows absolute numbers ± SD of NKT cells. (E–F) Splenocytes from B6, Jα18−/−, BAFF−/−, APRIL−/−, and DKO mice were stimulated in vitro with α-GC and incubated for 48 h before collecting supernatants and measuring IL-4 (E) and IFNγ (F) by ELISA. Data show mean ± SD for triplicate samples. Data shown in A–F are representative of two independent experiments.

