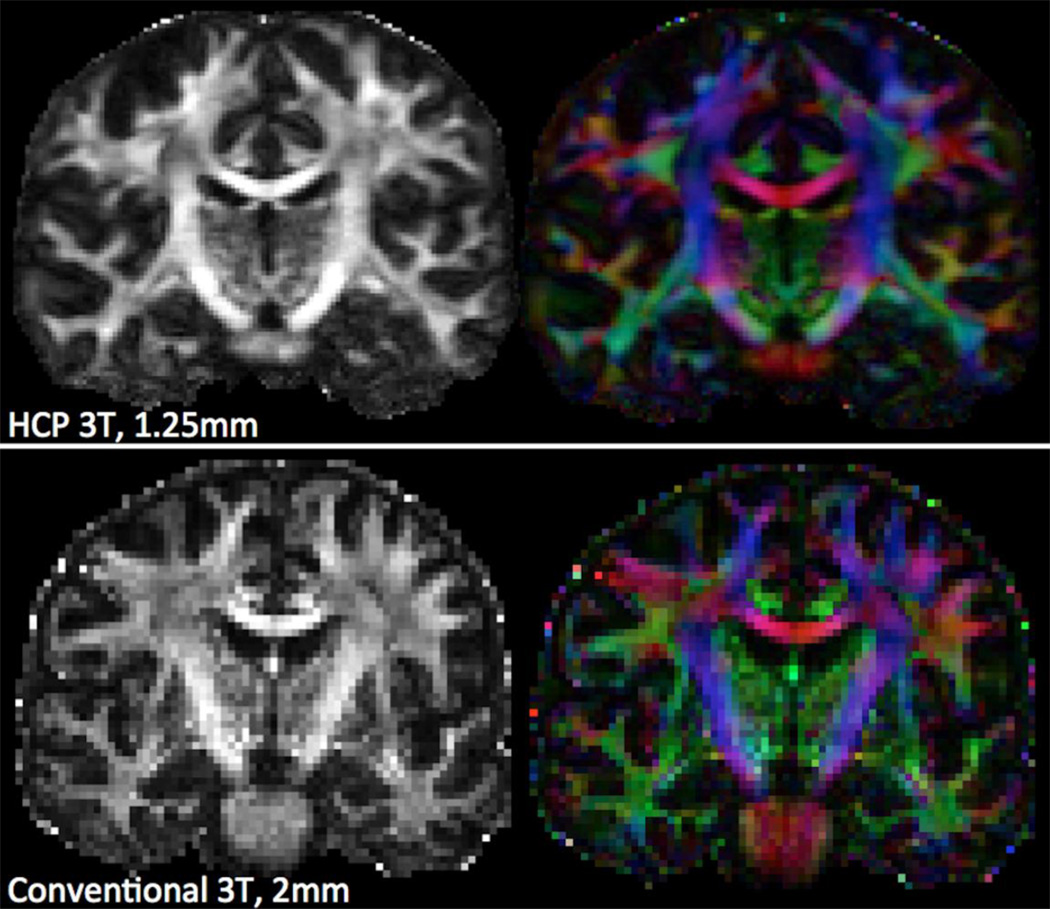
Figure 12.
Coronal views of fractional anisotropy (FA) and RGB-color coded direction maps obtained using the DTI model on HCP data (top) and data from a different subject acquired using a Siemens Verio 3T system (bottom). Datasets are matched for acquisition time, but have slightly different positioning. The HCP dataset was a subset of the full multi-shell data, and comprised of 90 directions at b=1000 s/mm2 (acquired twice, at 1.25mm isotropic resolution, MB=3). The Verio dataset comprised of 60 directions at b=1000 s/mm2 (acquired twice, at 2mm isotropic resolution, no MB). For both cases, the same distortion correction pipeline was utilised.

