
Figure 3. Msr1 deficiency does not affect KRN T cell activation.
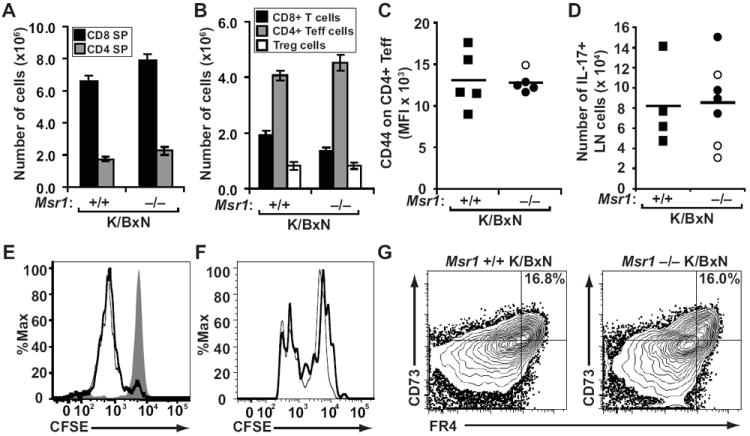
T cell subsets from (A) thymus and (B) spleen were enumerated among K/BxN mice of the indicated Msr1 genotypes. The values plotted are means ± SEM; n=5 mice per genotype. (C) Surface expression of CD44 measure by mean fluorescence intensity (MFI) on splenic CD4+ effector T cells from Msr1+/+ (squares) and Msr1−/− (circles) K/BxN mice was determined by flow cytometry. (D) The number of CD4+ lymph node T cells expressing intracellular IL-17 was determined by flow cytometry. In both C and D, filled shapes indicate individual arthritic animals, open shapes indicate non-arthritic animals; bars represent mean values. (E) CFSE-labeled naïve CD4+ T cells from KRN/B6 donor mice were adoptively-transferred into Msr1+/+ (thick line) or Msr1−/− (thin line) H-2b/g7-expressing recipient mice or control C57BL/6 (H-2b) mice (shaded histogram) and harvested 48 hours later for flow cytometric analysis. The data shown are representative of 3 separate experiments (n = 8 total mice per group). (F) CFSE-labeled, congenically-marked CD4+ T cells (105) from Msr1+/+ K/BxN mice (thick line) or Msr1−/− K/BxN mice (thin line) were adoptively transferred together into H-2b/g7-expressing hosts and harvested 3 days later for flow cytometric analysis. Data represent 2 experiments with a total of 7 recipient mice. No CFSE dilution was seen in H-2b hosts (not shown). (G) Expression of the T cell anergy markers CD73 and FR4 was evaluated among CD4+ splenocytes and lymph node cells in the indicated mice. Data represent 2 experiments with a total of 3 mice/group.