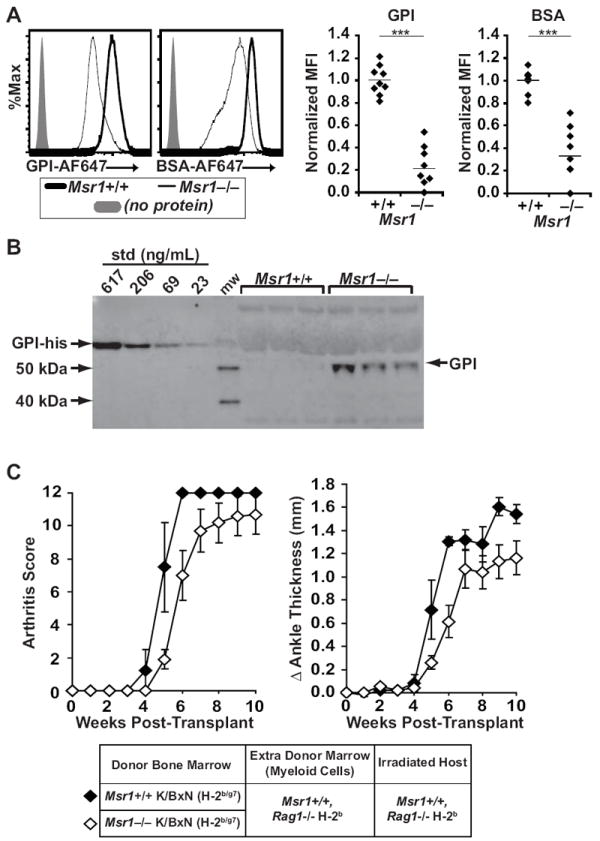
Figure 6. Msr1-deficient mice have increased circulating GPI, leading to impaired B cell activation.

(A) Peritoneal macrophages from Msr1+/+ (thick line) and Msr1−/− (thin line) B6 mice were incubated with fluorescently-labeled GPI (left histogram), fluorescently-labeled irrelevant protein (BSA, right histogram), or no protein (grey shade) and fluorescent intensity was analyzed by flow cytometry as a measure of protein uptake. The histograms show representative plots. The right panels show MFI values for individual mice, with bars indicating mean values. (B) Serum GPI concentrations were determined by Western blot in 8-week-old Msr1+/+ and Msr1−/− μMT−/− mice using a standard curve of GPI-His. Three mice from each genotype representing the range of GPI concentration are shown. The rationale for using μMT−/− mice is explained in the text. (C)Rag1−/− recipient mice were sublethally irradiated and transplanted with a mixture of 10×106 bone marrow cells from Msr1+/+ K/BxN mice (filled diamonds, n = 4) or Msr1−/− K/BxN mice (open diamonds, n = 10) plus 5×10⁶ bone marrow cells from Rag1−/− mice as a source of additional Msr1-sufficient myeloid cells. Arthritis was assessed via clinical arthritis scores (left) and changes in ankle thickness (right). Data are compiled from three separate experiments; plotted values are means ± SEM, and there is no statistical difference between the two groups via repeated measures ANOVA.
