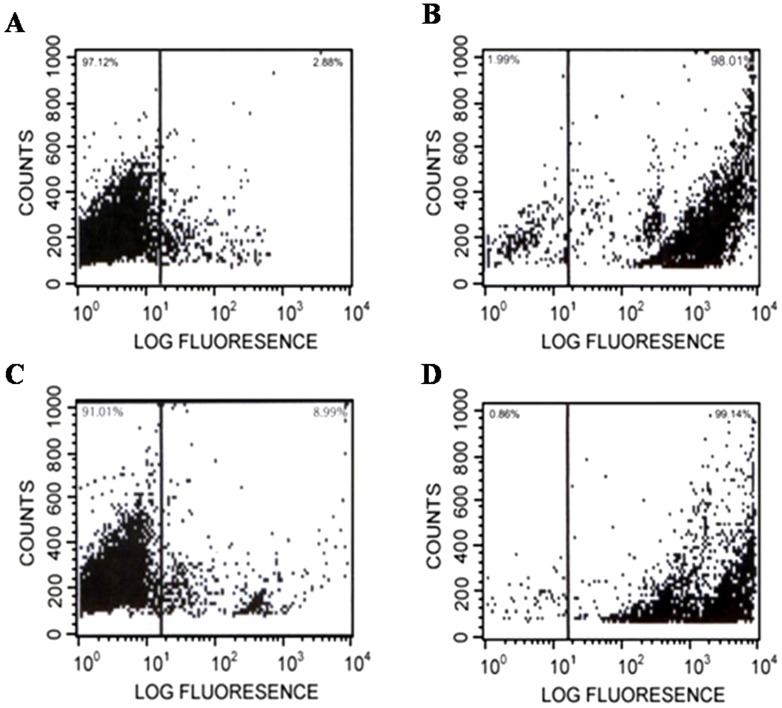
Figure 2. Flow cytometric analysis of cell membrane permeability.
Flow cytometric analysis showing PI uptake by C. albicans cells treated with the MIC of Anal 3 or Anal 3-Pro. Increments in the log fluorescence signal represent peptide-induced PI uptake: (A) no peptide, (B) Anal 3, (C) Anal 3-Pro and (D) melittin.

