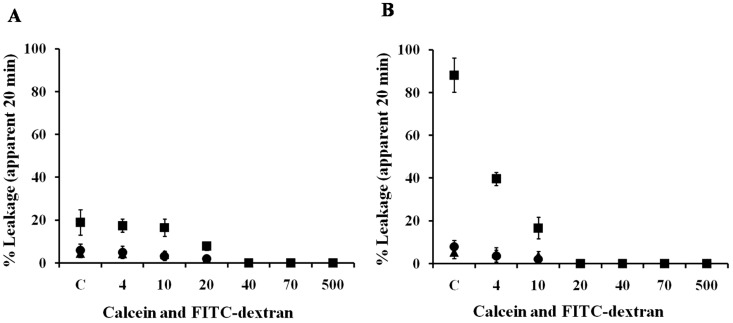
Figure 5. Sizes of the different pores formed between peptides.
The lipid compositions (A, PE/PG (1∶1); B, PC/CH (1∶1)) of the liposomes containing calcein or FD4, 10, 20, 40, 70 or 500 are indicated in the text; they were prepared and quantified as described in Materials and Methods. The release of calcein and dextran were fluorometrically determined. The apparent percentage of release was calculated as 100×(F-Fo)/(Ft-Fo), where F and Ft are the fluorescence intensities prior to and after the addition of each peptide (▪, Anal 3-Pro; ▴, TAT; •, buforin II), respectively, and Fo is the fluorescence of the intact vesicles. C represents calcein in each figure. Values are expressed as an average of three independent measurements. Error bars represent the standard error of the mean (n = 4).

