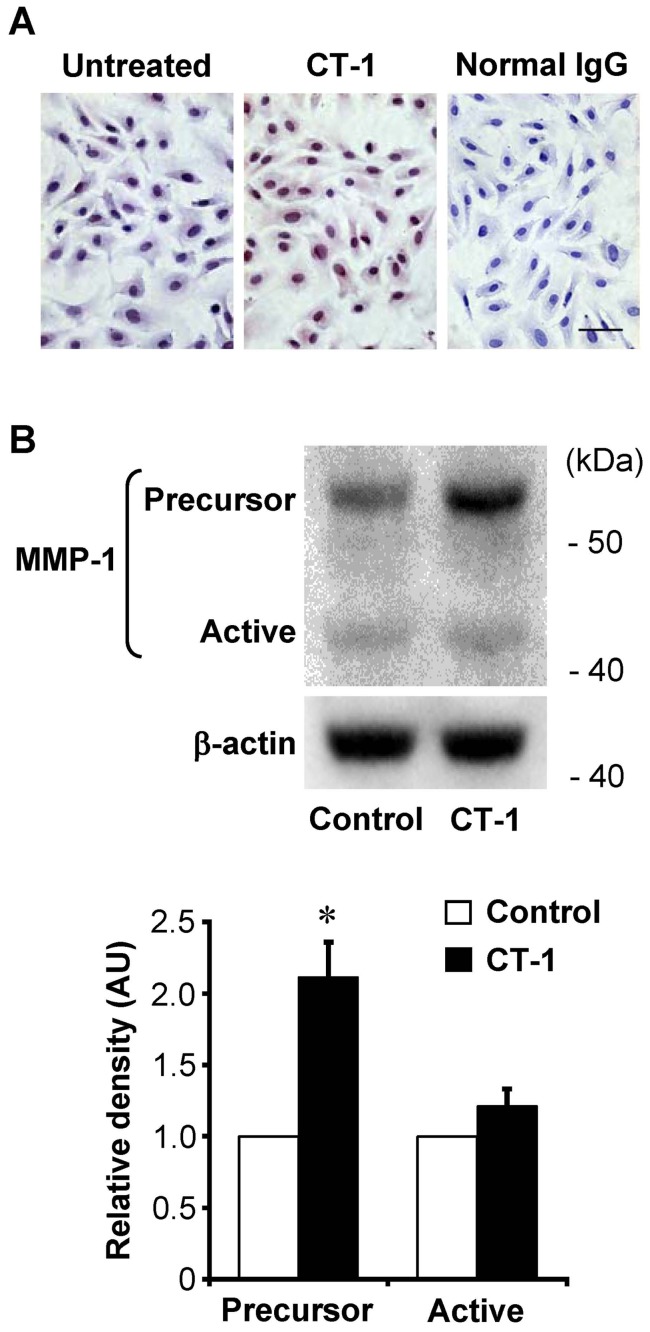
Figure 2. Effect of CT-1 on MMP-1 protein expression.
(A) Immunocytochemical staining for MMP-1 in HAECs treated with or without 10−8 mol/L CT-1 for 24 hrs. Normal mouse IgG served as a negative control. Original magnification; ×400. Bar = 25 μm. (B) Western immunoblot analysis of the whole cell lysates using anti-MMP-1 antibodies that recognize both the precursor and the active forms of MMP-1. Bars represent densitometric data of each expression signal after normalization to β-actin and relative to control. *P<0.01 vs. control (n = 3).

