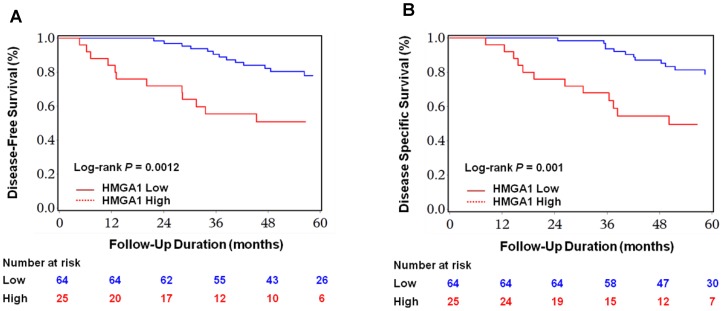
Figure 3. Kaplan-Meier curves for survival in UM patients.
Survival of UM patients were estimated according to HMGA1 expression levels and Ki67 LI. Significant differences in disease-free survival rates were observed (A, B). Significant differences in disease-specific survival rates were also observed (C, D). P values were calculated with a log-rank test.

