
Fig. 1.
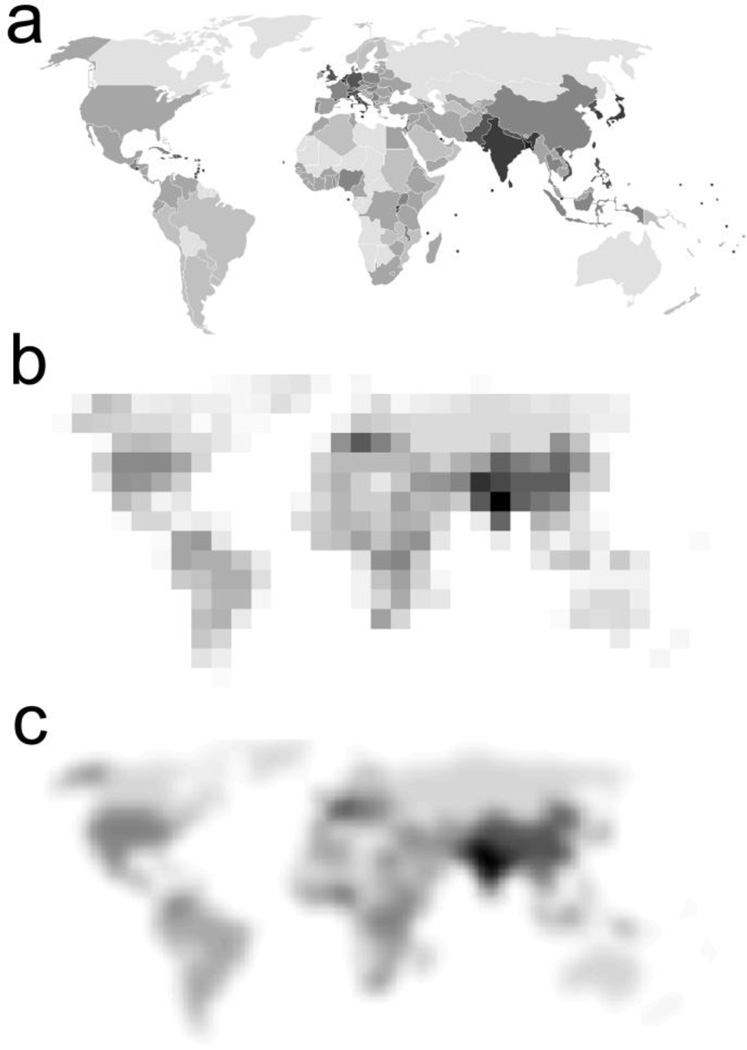
The schematic of random parcellation of world population density map. (a) Original world population density map with well-defined boundaries between countries. (b) Random square masks were used to parcellate the map and the value in each mask is the mean of population density covered by the mask. (c) Fifty random parcellation schemes were generated and the results were averaged. It can be seen that a great deal of world population density was revealed with the random parcellation method (e.g., the countries with highest population densities could be easily identified in b, with even more details in c) even though no prior knowledge on the boundaries of the countries is available. Extremely high network resolutions were avoided in our analyses due to the large inter-subject misregistration of parcels under the high network resolutions.