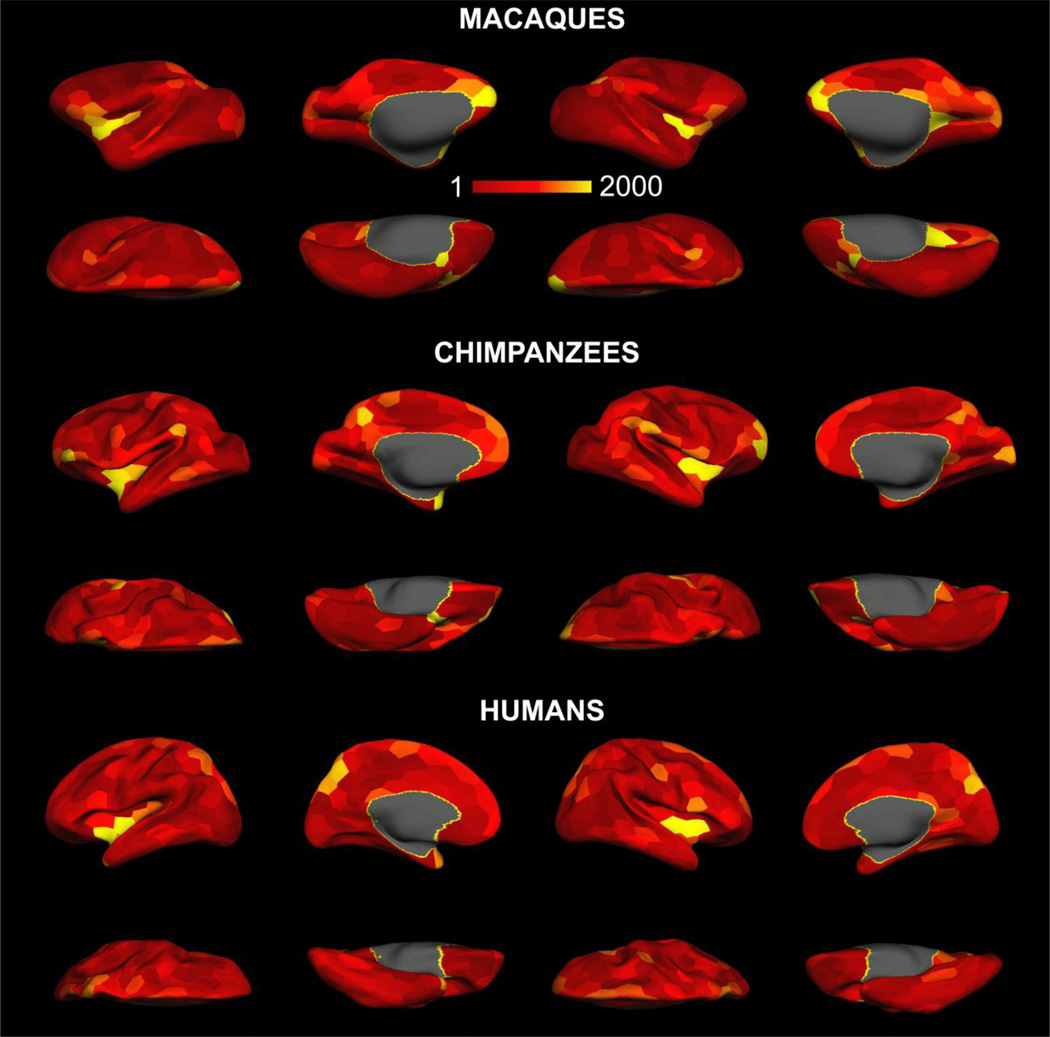
Fig. 4.
Betweenness centrality of the brain networks from macaques, chimpanzees and humans at the network density of 10% and resolution of 300. For each species, the left two columns represent the lateral and medial views of the left hemisphere and the right two represent the right hemisphere. For all three species, the color scale was set identically.

