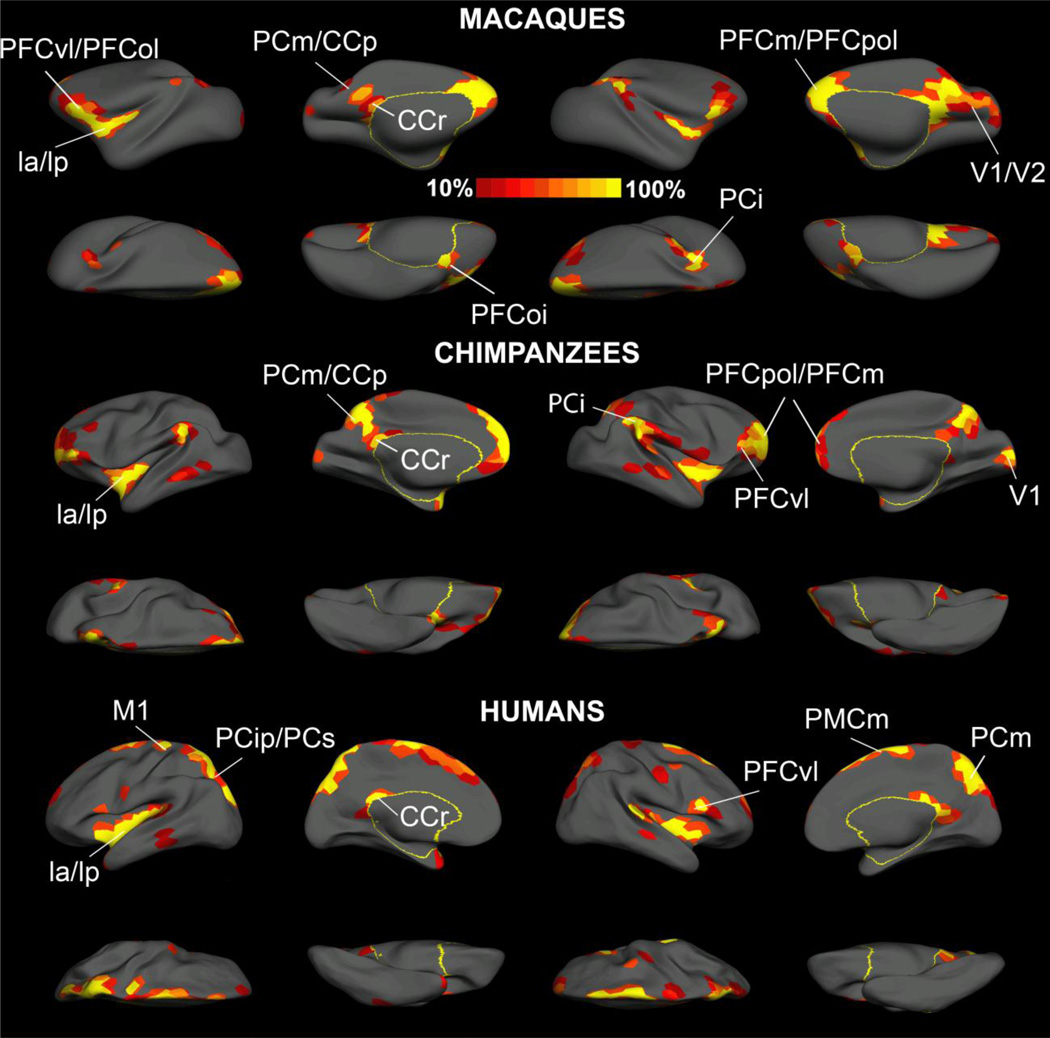
Fig. 5.
The probability map of the putative hubs in macaques (upper two rows), chimpanzees (middle two rows) and humans (bottom two rows). For each species, the left two columns showed the lateral, medial, dorsal and ventral views of the left hemisphere and the right two columns showed the corresponding views for the right hemisphere. The cortical parcels with at least two out of four centrality measures placed in the top 10% were first identified under five network densities (10%, 15%,20%,25%,30%) and two resolutions (N=300,600) respectively. Then these hubs that were identified under a specific network density and resolution were binarized and averaged for a probability map. Brain regions with high intensities in the resulting map are frequently identified as hubs. Labels for humans and macaques were based on the nomenclature proposed by Kotter and Wanke (2005) and areas for chimpanzees were labeled based on their putative homologues in humans and macaques (Kotter and Wanke, 2005). Abbreviations: CCp, posterior cingulate cortex; CCr, retrosplenial cingulate cortex; Ia, anterior insular; Ip, posterior insula; M1, primary motor cortex; PCi, inferior parietal cortex; PCip, cortex of the intraparietal sulcus; PCm, medial parietal cortex; PCs, superior parietal cortex; PFCm, medial prefrontal cortex; PFCoi, intermediate orbital prefrontal cortex; PFCol, orbitolateral prefrontal cortex; PFCom, orbitomedial prefrontal cortex; PFCpol, polar prefrontal cortex; PFCvl, ventrolateral prefrontal cortex; PMCm, medial (supplementary) premotor cortex; V1, primary visual cortex; V2, secondary visual cortex;

