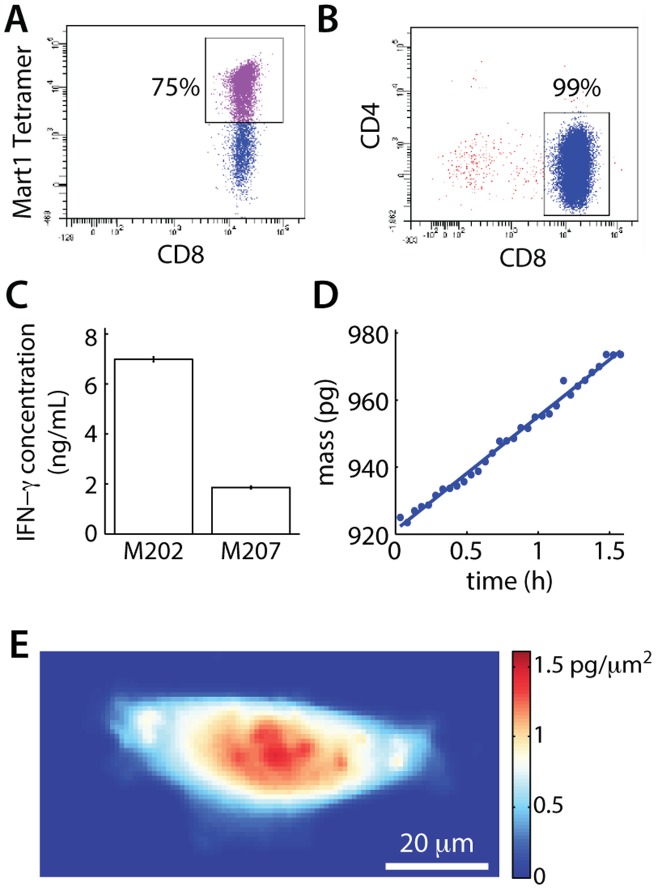
Figure 2. Transduction of CD8+ enriched PBMCs.
(A) Flow cytometry data of transduced T cells showing typical transduction efficiency of donor PBMCs. (B) Flow cytometry of CD8+ enriched population showing CD8+ T-cell enrichment efficiency. (C) IFNg release assay validating F5-transduced, CD8+ enriched T cell activation following co-culture with HLA-matched MART1 expressing M202 cells. Negative control M207 cells express MART1, but are HLA-mismatched. (D) Mass vs. time of the healthy M202 cell shown in (E), demonstrating the viability of target cells on the interferometer stage.

