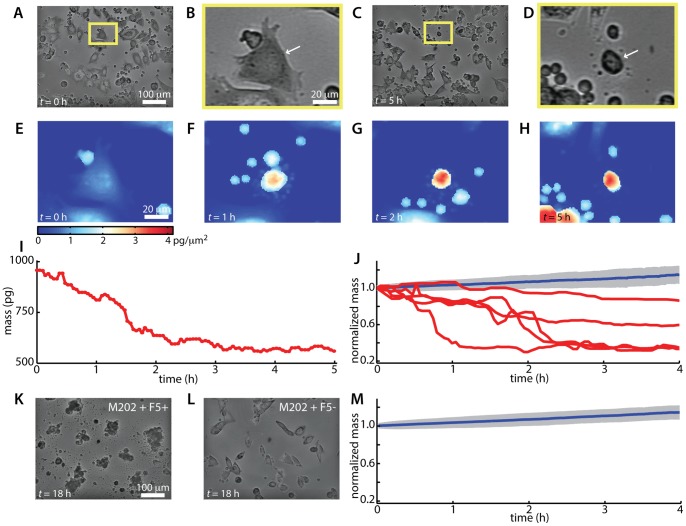
Figure 3. LCI tracks target cell death during T cell mediated cytotoxicity.
(A–H) Images of a single cytotoxic event occurring immediately after the start of imaging (t = 0 is approximately 30 min after plating CTLs onto target cells), (A–D) intensity images at t = 0 and 5 h of imaging demonstrating CTL mediated target cell killing. Yellow boxes in (A) and (C), indicate the subregion in images (B) and (D). Arrows in (B) and (D) indicate the target cell tracked by mass profiling in (E–I). (E) LCI mass profile of selected target cell after initiation of persistent contact with a target cell at the start of imaging. (F–H) LCI mass profile of dying target cell. (I) Measured total mass vs. time for target cell shown in (E–H). (J) Normalized mass of killed and healthy target cells over time. Normalized mass is mass divided by initial mass. Healthy cells show roughly 15% increase in normalized mass over 4 h (blue line indicates mean of n = 311 healthy M202 cells, grey region indicates +/− SD). Killed target cells (red lines) show a decrease in mass of 20 to 60% over 1–4 h. (K) intensity image of stage location shown in (A) and (C) after 18 h of imaging, showing nearly complete death of target cells. (L) Intensity image of stage after 18 h of imaging M202 cells plated with untransduced (F5-) CD8+ T cells showing viability of target cells plated with nonspecific T cells. (M) Normalized mass vs. time for n = 2058 healthy M202 cells treated with untransduced, control CTLs, showing roughly 15% increase in mass over 4 h.

