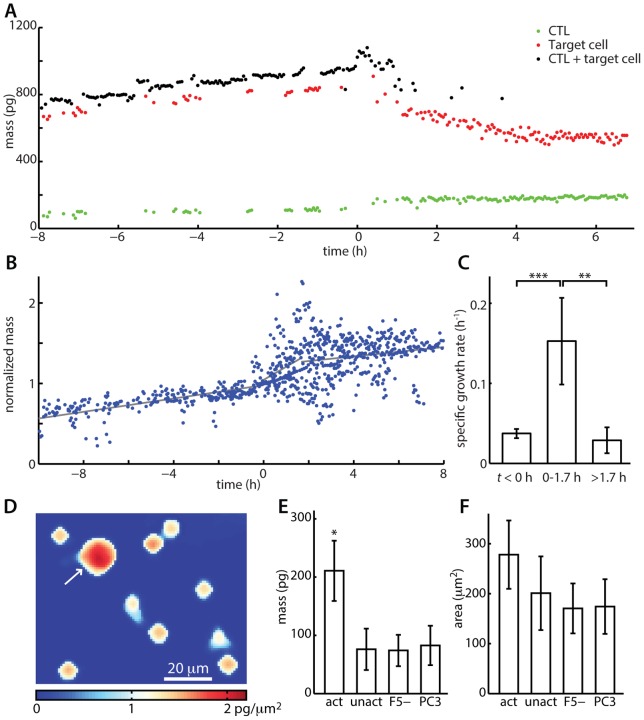
Figure 4. LCI measures CTL mass and mass accumulation rate during T cell mediated cytotoxicity.
(A). Mass versus time of an activated CTL and corresponding target cell. t = 0 h is the point at which the target cell detaches from the substrate at the beginning of cell death. CTL + target cell refers to total mass of both cells in frames where they could not be measured separately. (B) Normalized mass versus time of 10 CTL-mediated cytotoxicity events. CTL mass is normalized relative to the mass at the time of target cell morphology change, which is used as the t = 0 h point for all traces. Gray lines show best fit lines used for determining mass accumulation rates. (C) Average mass accumulation rate of CTLs before a cytotoxic event, during the first 100 min of a cytotoxic event, and after the first 100 min of a cytotoxic event demonstrating an approximately 4-fold increase in mass accumulation during the first 100 min of a cytotoxic event. (D) LCI image of 9 unresponsive and 1 cytotoxic T cell illustrating an approximately 3-fold difference in mass. The white arrow indicates the activated T cell, as determined by tracking this cell after persistent contact with target cell and subsequent target cell death. (E) The average mass of 116 activated CTLs is approximately 2.8-fold greater than the average mass of unresponsive controls. (F) Average area of activated CTLs is only approximately 1.4-fold greater than non-activated controls and not significant at the 95% confidence level, illustrating the utility of LCI mass measurements for determining CTL activation. Error bars in C show 95% confidence intervals. Error bars in E and F show +/− SD. * p<0.05, ** p<0.01, *** p<10−3. act = activated/cytotoxic, 116 cells, n = 3 experiments. unact = unactivated/unresponsive, 359 cells, n = 3 experiments. F5- = untransduced, F5-negative control experiment, 530 cells, n = 2 experiments. PC3 = PC3 cell, HLA-mismatched irrelevant antigen control, 3015 cells, n = 3 experiments.

