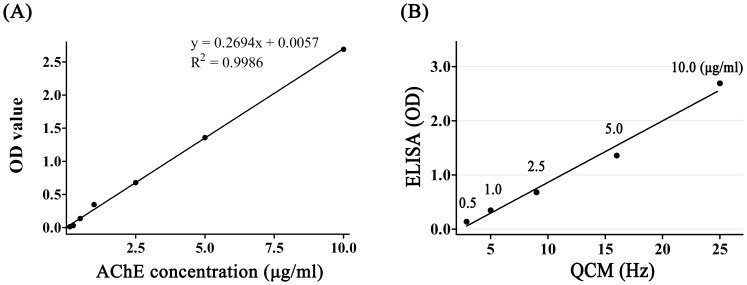
Figure 3. Detection of AChE using ELISA.
(A) The OD value increased with increasing concentrations of AChE. A linear correlation was observed between the OD values and the concentrations of AChE from 0.125 to 10 µg/ml. (B) The correlation between QCM and ELISA was analyzed using SPSS. The correlation coefficient was 0.9924 (P<0.05), suggesting a strong correlation between the QCM and ELISA results.

