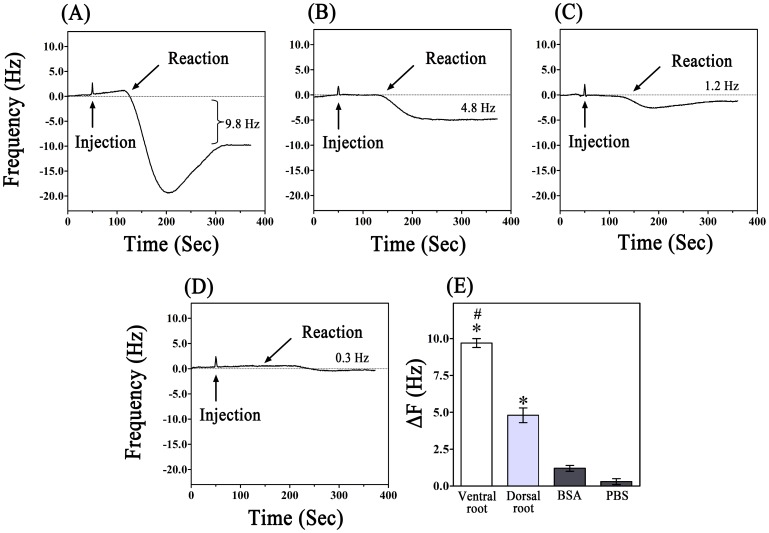
Figure 4. Detection of solutions of the ventral and dorsal roots using the QCM system.
(A) The detection process for the ventral root solution. A 9.8-Hz decrease in the frequency was induced by the ventral root solution. (B) AChE in the dorsal root solution was also detectable using the QCM device. A 4.8-Hz frequency shift was induced by the dorsal root solution. (C), (D) The BSA and PBS showed only a relative small reaction with the antibody on the chip. The frequency shifts produced by the BSA and PBS were 1.2 and 0.2 Hz, respectively. (E) The frequency change (ΔF) after the antigen-antibody reaction was measured and calculated. #P<0.05, vs. dorsal root, BSA and PBS. *P<0.05, vs. BSA and PBS.

