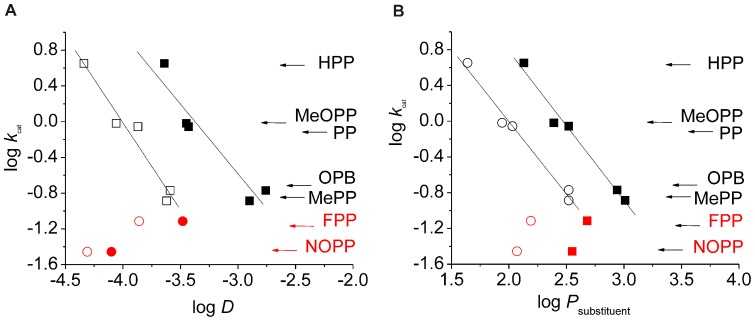
Figure 3. Correlation of reaction velocity with substrate and product hydrophobicity.
(a.) Correlation of S. coelicolor Hms log k cat values with log D values for the substrates phenylpyruvic acid (PP), p-hydroxy-PP (HPP), p-methoxy-PP (MeOPP), p-methyl-PP (MePP), 2-oxo-4-phenylbutanoic acid (OPB) (black squares). Note that p-fluoro-PP (FPP) and p-nitro-PP (NOPP, red squares) are not included in the regression analysis. The respective correlation with product log D is indicated by hollow circles. (b.) A correlation analogous to (a.) is depicted, whereby log k cat is plotted against the log P of the respective substrate and product substituents.

