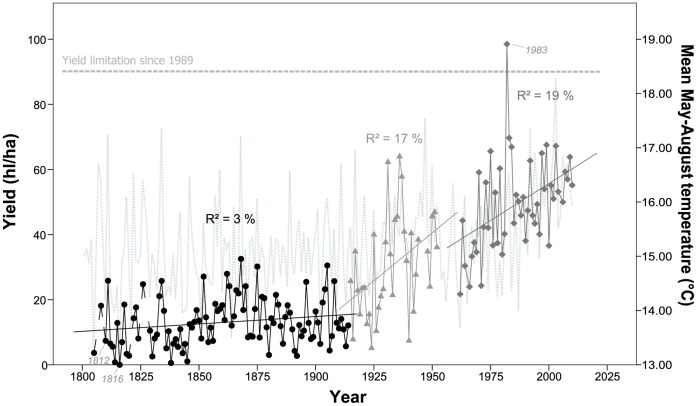
Figure 2. Time series of mean yield (hl/ha), originating from Eifler[24], [54] and Weigand [25] (black solid circles), from Bayerisches Staatsministerum für Ernährung [26] (light grey solid triangles) and annual vintage records (dark grey solid rhombs).
Mean April to August temperature are plotted against the right y-axis (dotted line in light grey). Regression lines superimposed. Dotted horizontal line indicates yield limitation (90 hl/ha) in force since 1989.

