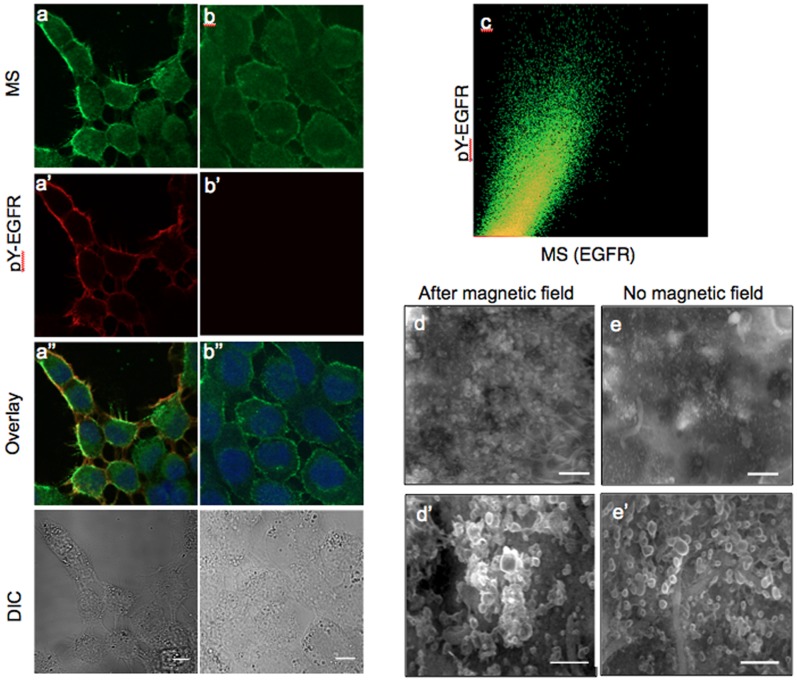
Figure 2. Magnetic field induced activation of EGFR.
Confocal image analysis-left column after 60 sec magnetization or right column without magnetiztion. (a,b) MS- Alexa488-biocytin, green; (a′, b′) EGFR activation (pY-EGFR1068) red; (a′′,b′′) overlay of red, green and DAPI DNA staining, blue, images; and DIC image (bottom). Scale bar is 10 µm. (c) Two-dimensional colocalization histogram for the same confocal sections a and a′ after background subtraction. SEM images of A431 cells reacted with MS after (d,d′) and without (e,e′) application of magnetic field. Scale bars, 1 µm for (d & e) and 500 nm for (d′ & e′), respectively.

