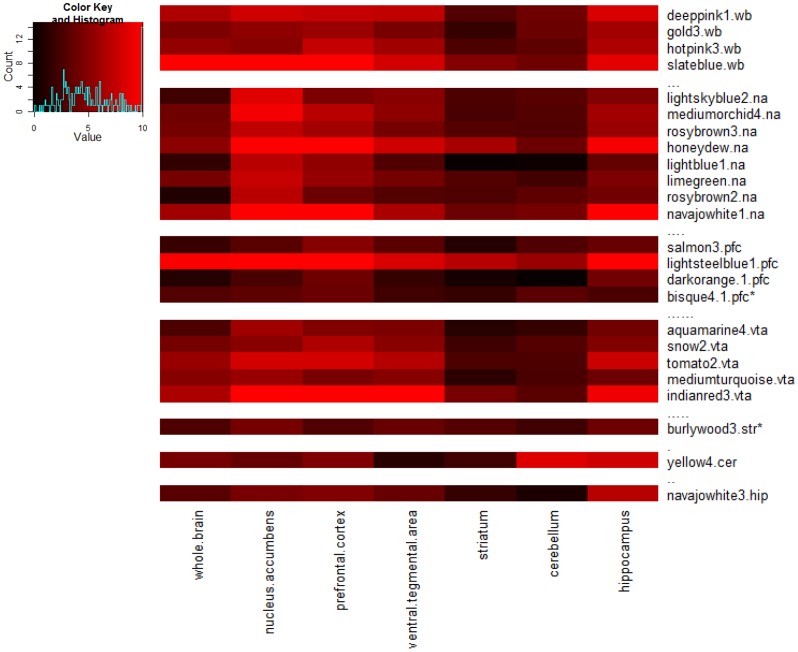
Figure 2. Reproducibility of Candidate Modules and Conservation of Candidate Modules across Brain Regions and Whole Brain.
Conservation of candidate coexpression modules across individual brain regions and whole brain is represented by a Z summary score (color scale: 0 (black) to 10 (bright red)) (Langfelder et al., 2011; see text). In this graphic, Z summary scores above 10 are truncated to 10. The coexpression modules on the vertical axis are followed by an abbreviation indicating the network from which the module is derived: wb, whole brain; cer, cerebellum; hip, hippocampus; na, nucleus accumbens; pfc, prefrontal cortex; str, striatum; vta, ventral tegmental area. For each module, the Z summary score for conservation within each of the other datasets is shown. In addition, the average bootstrapped Z summary score is illustrated for the dataset from which the module was originally derived (represents reproducibility of candidate module in its original dataset). *Average Z summary score for reproducibility is within one SD of 2.

