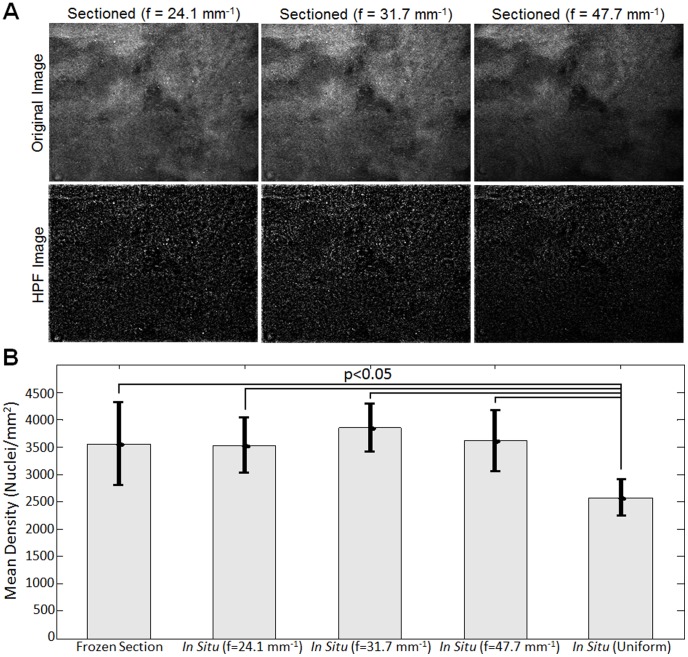
Figure 10. Results demonstrating the impact of illumination frequency on quantification of cell nuclei density.
(A) Sectioned images of mouse sarcoma tissue at multiple illumination frequencies. The corresponding HPF processed images are shown which demonstrate the isolation of cell nuclei. (B) Mean density of cell nuclei extracted from images mouse sarcoma tissue. The nuclear density extracted from the 50 µm thick frozen section images (N = 9) was compared to density extracted from in situ tissue imaging (N = 5), both uniform and sectioned (f = 47.7, 31.7, 24.1 mm−1) images.

