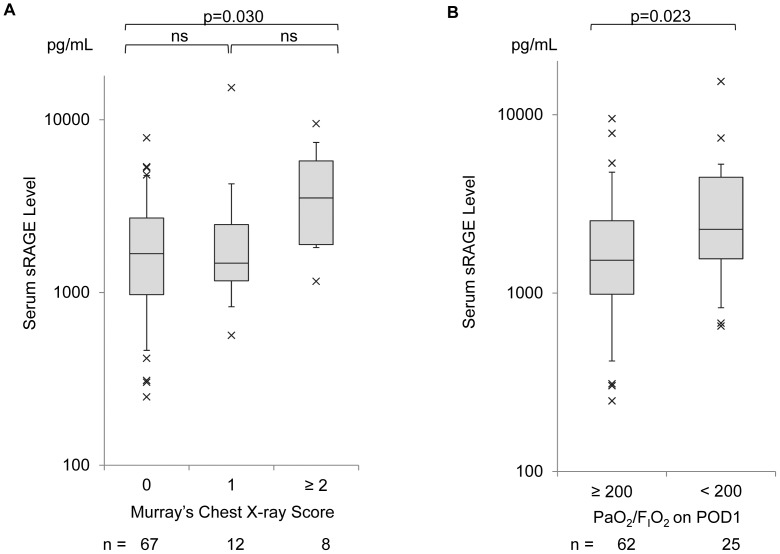
Figure 3. Relationship between serum levels of the soluble isoform of the receptor for advanced glycation end products (sRAGE) and the variables reflecting the condition of the lung.
(A) Relationship between serum sRAGE and radiographic presentations scored by Murray’s chest X-ray score. Box-whisker plots show the 5th, 25th, 50th, 75th, and 95th percentile in each study condition. p-values for the three-group comparison were calculated using Tukey’s test; (B) Relationship between serum sRAGE levels and PaO2/FIO2 on POD 1. Patients were divided into two groups using a cut-off value for PaO2/FIO2 = 200. Box-whisker plots show the 5th, 25th, 50th, 75th, and 95th percentile in each study condition. The p-value was calculated using the Mann-Whitney U-test.

