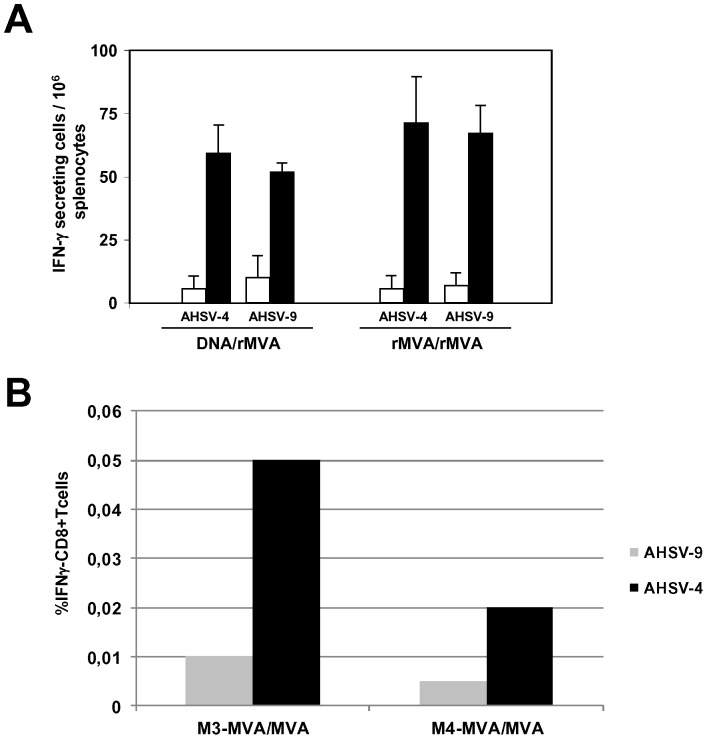
Figure 5. Cellular immune response observed in IFNAR(−/−) mice vaccinated with DNA/rMVA or rMVA/rMVA expressing VP2/NS1.
(A) ELISPOT assays measuring IFN-γ-secreting T cells in the spleen of immunized mice. Mice were immunized with DNA/rMVA or rMVA/rMVA expressing VP2 and NS1 from AHSV-4 as described in Materials and Methods. Splenocytes were harvested at day 14 post-vaccination. Non-immunized mice were used as controls. Black (immunized) and white (non-immunized) bars represent the SFC mean number ± standard deviation for the ELISPOT within each group. 104 PFUs of UV inactivated virus per well were used as stimulus in each experiment. (B) Intracellular staining of IFN-γ, in T CD8+ cells of rMVA/rMVA-VP2/NS1 immunized IFNAR(−/−) mice. Two weeks after second immunization, spleens were harvested and the splenocytes were stimulated with 104 PFUs of UV inactivated virus per well. At 24 h post-stimulation, intracellular IFN-γ production was analysed in CD8-positive cells by flow cytometry. Grey bars: mice stimulated with AHSV-9; black bars: mice stimulated with AHSV-4. M3-MVA/MVA and M4-MVA/MVA are the values of two representative rMVA/rMVA immunized mice.

