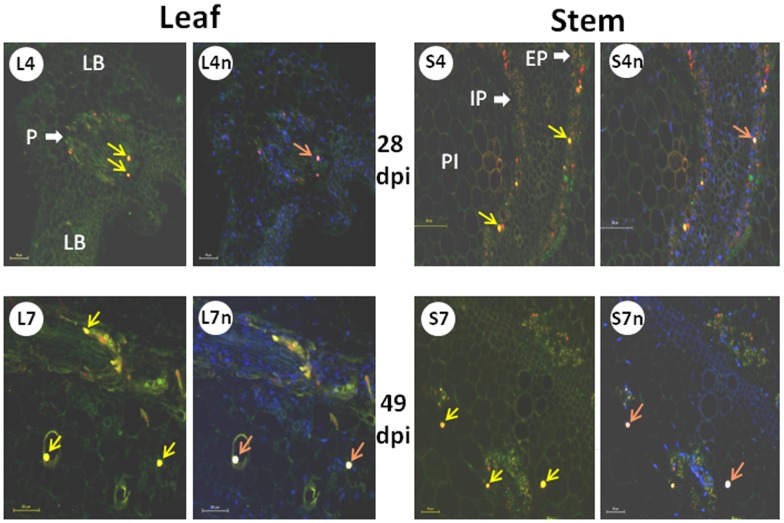
Figure 5. Co-localization of CP and HSP70 in cytoplasm and nucleus of infected tomato leaf and stem at 28 and 49 dpi.
Leaf: cross-section through the midrib (P, phloem; LB, leaf blade). Stem: cross section between true leaves 2 and 3 (IP and EP, internal and external phloem; PI, pith). Fluorescent microscopy using primary anti-CP antisera and Cy3-labeled secondary antibody, primary anti-HSP70 antisera and Cy2-labeled secondary antibody; nuclei were DAPI stained. L4 and L4n: leaves 4 weeks after the onset of infection, without and with nuclei stain, respectively; L7 and L7n: same but 7 weeks after the onset of infection. S4 and S4n: stems 4 weeks after the onset of infection, without and with nuclei stain, respectively; S7 and S7n: same but 7 weeks after the onset of infection. Viral CP appears as red, cellular HSP70 as green, and nuclei as blue spots; CP in nuclei appears as violet, HSP70 in nuclei as light blue spots; CP co-localizing with HSP70 appears as orange to yellow spots (yellow arrows), CP co-localizing with HSP70 in nuclei - as pink to white spots (pink arrows). Bar: 50 µm, except for S4 and S4n, 100 µm.

