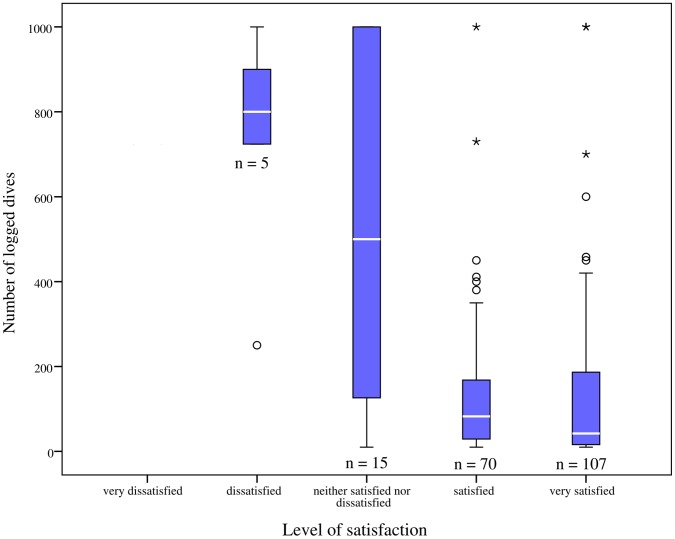
Figure 3. Divers’ satisfaction of artificial reef diving according to number of dives respondents had logged.
Boxes represent the inter-quartile range that contains 50% of values. The median value is represented by a line across the box. The whiskers extend to the 5th and 95th percentiles and circles and stars outside the box plots are outliers. Sample size is represented by numbers below each box.

