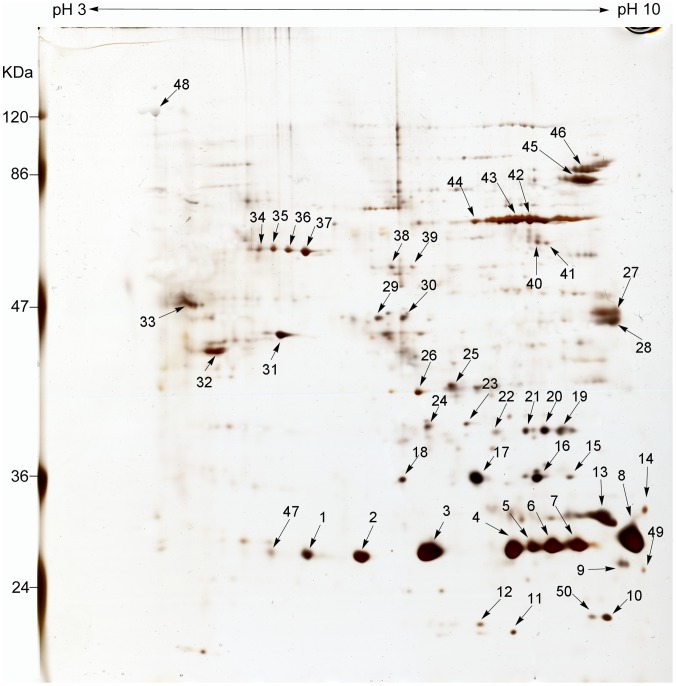
Figure 1. 2-D PAGE reference map of surface-exposed proteins in R. heilongjiangensis.
R. heilongjiangensis biotinylated proteins isolated by biotin-streptavidin affinity purification were separated using a pH 3–10 NL IPG strip (Bio-Rad, Richmond, CA) in the first dimension followed by 12% SDS-PAGE. Numbers with arrowheads refer to the protein spots in the silver-stained gel. Protein spots excised from the gel were digested and subjected to ESI-MS/MS analysis. The relative molecular masses of the marker proteins are indicated in kDa on the left side of the figure and the protein spots identified by ESI-MS/MS analysis are listed in Table S2.

