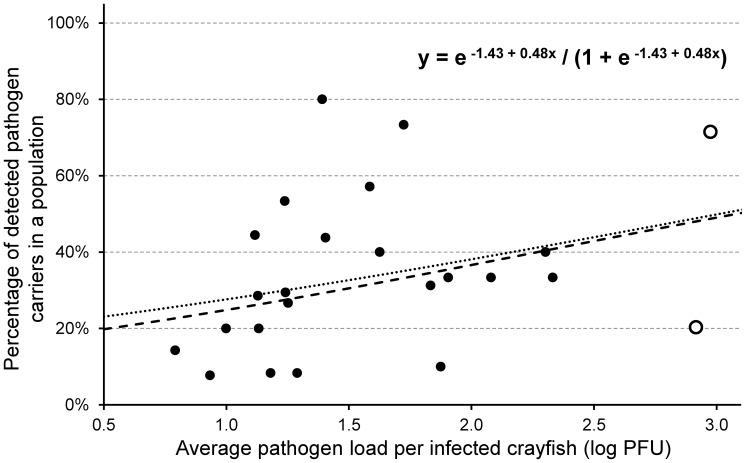
Figure 2. Relationship between the prevalence of A. astaci (in %; estimated as the proportion of individuals testing positive) in analysed French signal crayfish populations and the average pathogen load (expressed as log-transformed PFU-values) detected in infected individuals (with agent level A2 or higher) from each population.
The equation characterising the model estimated by logistic regression (dashed line) is given in the upper right corner; removal of two outlier populations with highest average pathogen load (indicated by empty circles) did not change the model substantially (dotted line, equation not shown). Note that when a quasibinomial instead of binomial distribution of errors is used (due to overdispersion in data), the increasing trend is non-significant.

