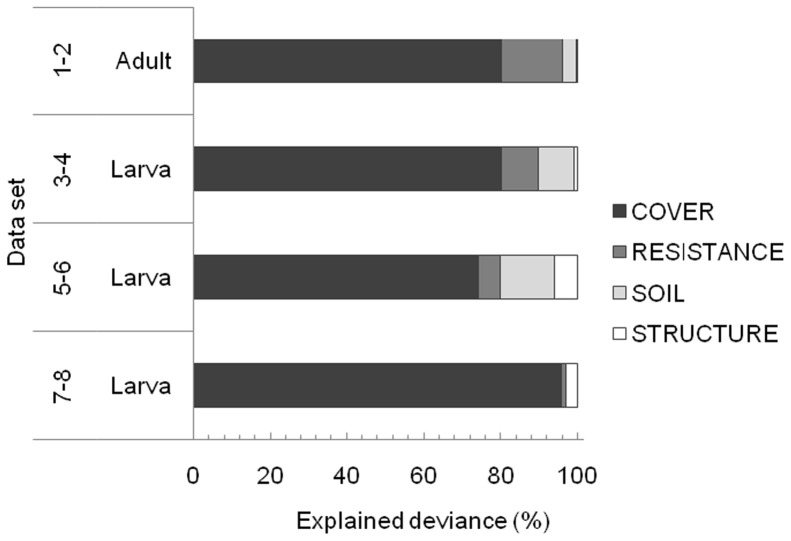
Figure 3. Joint percentage of the total deviance explained by the predictors in the abiotic (ABIOT) minimal adequate models (MAMs).
Mean values (N = 4) were computed from adult and larval presence/absence (PA) and abundance (AB) models of the two locations (A and B), and individually for each larval sampling scale. Abiotic predictor categories: COVER = percentage cover, RESISTANCE = vegetation resistance, SOIL = soil features, and STRUCTURE = habitat structure; see Table 2.

