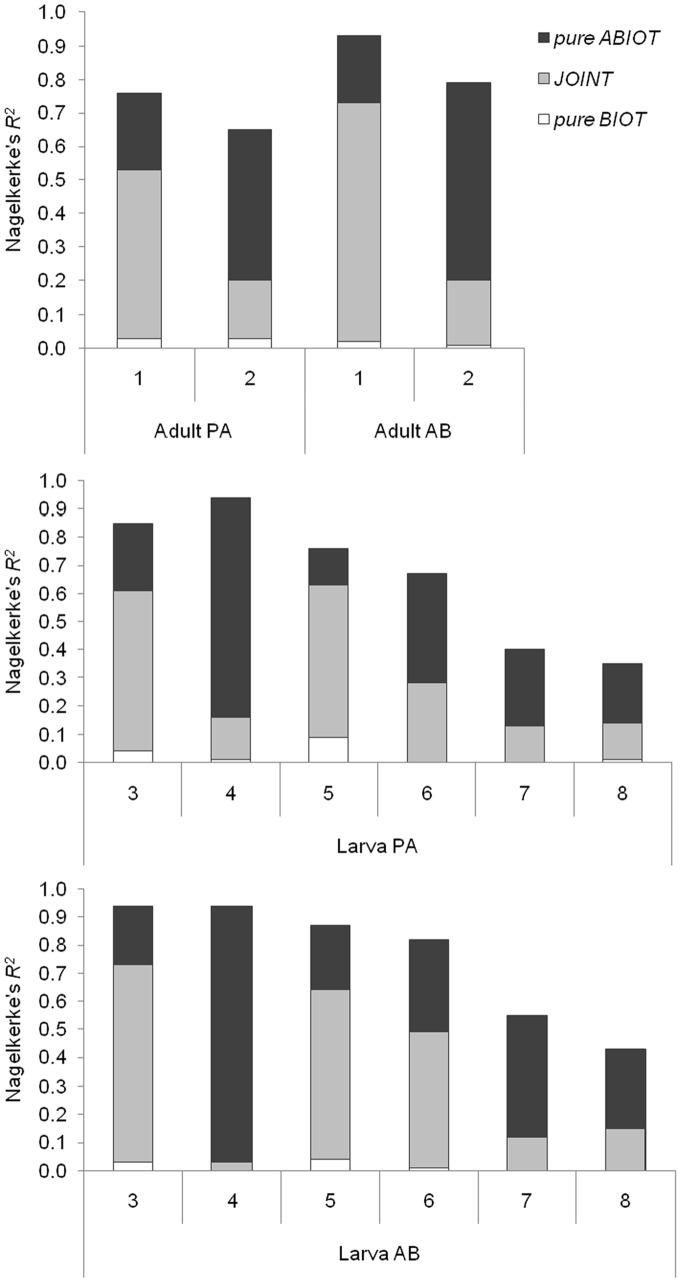
Figure 5. Partition of the goodness of fit measure (Nagelkerke’s R2) for the modelled data sets.
Pure ABIOT = independent contribution of the abiotic set of predictors to the total explanatory power, pure BIOT = independent contribution of the biotic set, JOINT = joint contribution of both predictor sets. PA = presence/absence, AB = abundance.

