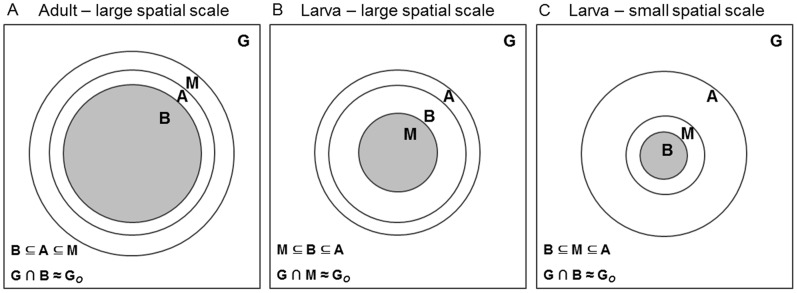
Figure 6. Life-stage modelling results interpreted by a simplified configuration of the BAM (biotic, abiotic, movement) diagram [2], [6], [56].
The regions in the BAM diagram represent areas in the geographic space: G = entire sampling area, A = area with suitable abiotic conditions, B = area with favourable biotic conditions, M = accessible area limited by movement restrictions and dispersal factors. The intersection of B, A and M represents the actual area of occupancy (GO = shaded area), equivalent to the occupied niche [1], [6]. Panels A and B illustrate the results of the adult and larval models at the scale of hundreds of meters (large spatial scale), respectively. Panel C incorporates the assumption supported by previous works [40], [41] that fundamental biotic constraints involving neighbouring larvae are likely to emerge at the scale of centimetres (small spatial scale). See text for further explanation.

