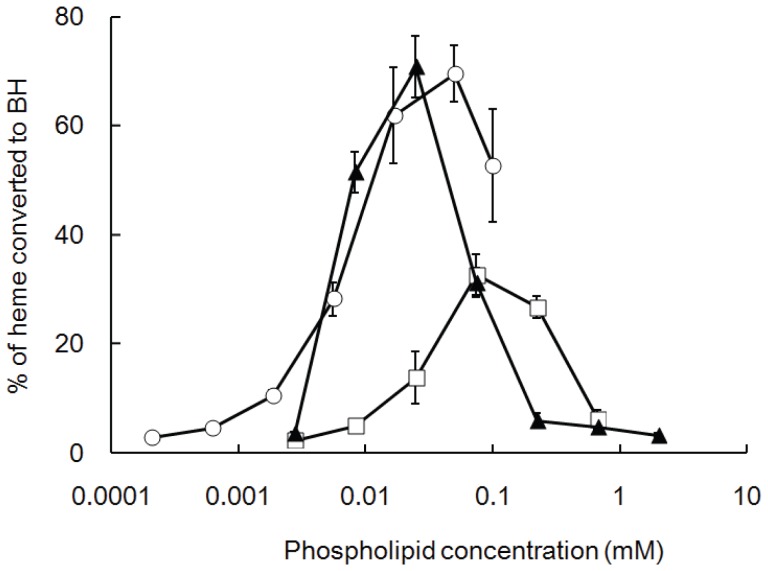
Figure 1. BH formation induced by various concentrations of phospholipids at 37°C.
The ordinate shows the amount of BH produced by incubation with various concentrations of phospholipids for 16 h, as expressed as the percentage of heme converted to BH. Values represent the mean ± SD (n = 3). The results were reproducible. Circle; dioleoyl-PC, triangle; dilauroyl-PC, square; dimyristoyl-PC.

